A proper connection graph is a must if you need to investigate a complex case with numerous individuals using different communication media. To name a few, it may be a drug-related case with several dealers and a network of buyers or a ring of sexual predators. The corporate sector might need graphs to investigate a circle of white-collar criminals stealing their company’s money or groups responsible for data leaks, data breaches, and even hacking incidents.
As a rule, cases of this kind require visualization of profiles together with connections between them to grasp, analyze, and demonstrate the essence of a case. That is the most efficient way of detecting and understanding links, patterns, and suspicious episodes.
This article is intended to show how one can use the relevant capabilities of Belkasoft Evidence Center X or Belkasoft X. As such, it will combine a brief overview of Belkasoft Connection Graph (‘how-to’) with a real-world scenario based on a group of card fraudsters. The case itself was, in general terms, is based on a real-life scenario.
What is Belkasoft Connection Graph and Why Do You Need It?
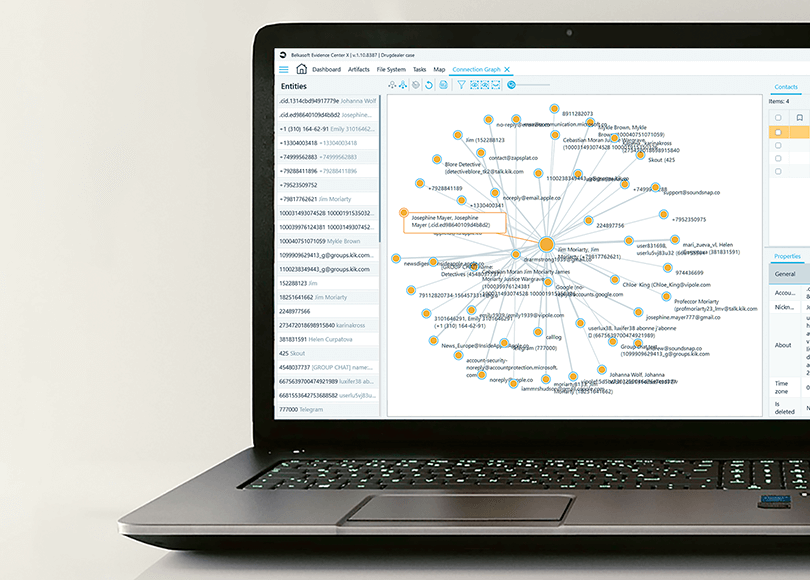
In Belkasoft X, Connection Graph is a special window, which displays communications between individuals involved in a particular case.
To whom could it be helpful? In fact, there are many situations, all of which may be of interest to you.
- First, we mean those cases that involve a single perpetrator and numerous victims (in this case the graph of a case may resemble a star).
- Second, those involving groups of suspects with a single victim (it is likely that the picture will look like a circle).
- Third, it may be the most complex scenario with multiple perpetrators and numerous victims (in this case constellations may differ greatly from each other).
What unites all these cases is that you need a connection graph for all of them.
Real Life Case: Fraudsters
The case on which this guide is based did involve a group of fraudsters, i.e. those responsible for credit card fraud. As you know, there are many types of such crimes: hacked online shopping sites and payment systems, phishing, remote access agents and trojans, skimming, etc.
The case presented here was not extremely sophisticated. It was a series of phishing activities with perpetrators pretending to be bank clerks and online shopping account managers. Under fraudulent means, they would contact a victim to lure them into sharing sensitive card data. As for the communication media, the group mainly used PCs with VoIP-solutions installed on them. Cell phones were used to a lesser extent.
Our customer’s initial goal was to take possession of the computer and several other devices that had been used. These devices would then be forensically analyzed.
Working with investigators and examiners the following goals were made:
- Identification of as many victims as possible (the customer knew that some of them had not reported the issue to the police);
- Identification of the suspect’s accomplices (normally each victim was contacted on several occasions by different people for greater credibility)
- Identification of patterns used by the perpetrators.
How to Use Connection Graph: Theory and Practice
This section will demonstrate, step by step, how to use Connection Graph in Belkasoft X and, where applicable, will stress what the customer could achieve and did achieve via it.
Let’s begin.
- Start with analyzing a device and extracting artifacts with Belkasoft X
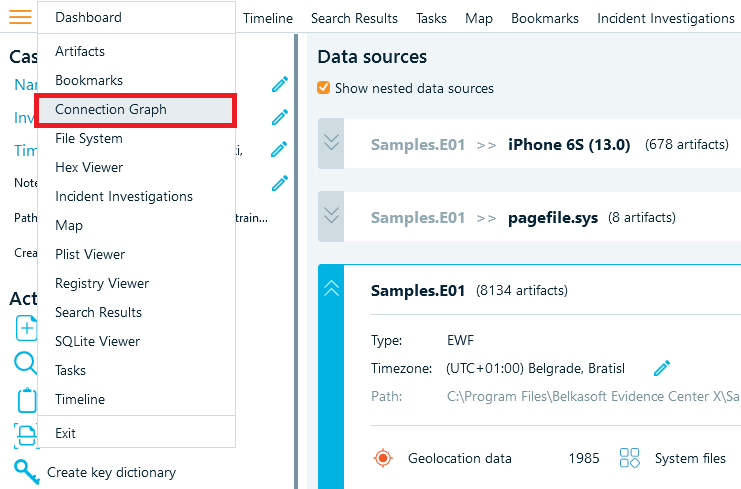
- Click on ‘Connection Graph’ menu item
- After that, your graph will be shown almost instantly.
- The following control elements are available via the icons above the ‘Connection Graph’. They all were used by the customer to examine different facets of the case.
- Isolate suspicious communities
- Identify potential ringleaders
- Track down their potential associates
- Exclude obviously uninvolved persons from the picture
- Investigate each and every episode of a case associated with every victim
- How To Analyze Windows 10 Timeline With Belkasoft at https://belkasoft.com/windows-10-timeline-analysis
- Remote Acquisition of Digital Devices with Belkasoft at https://belkasoft.com/remote-acquisition-digital-devices
- Belkasoft solutions for corporate customers at
https://belkasoft.com/corporate
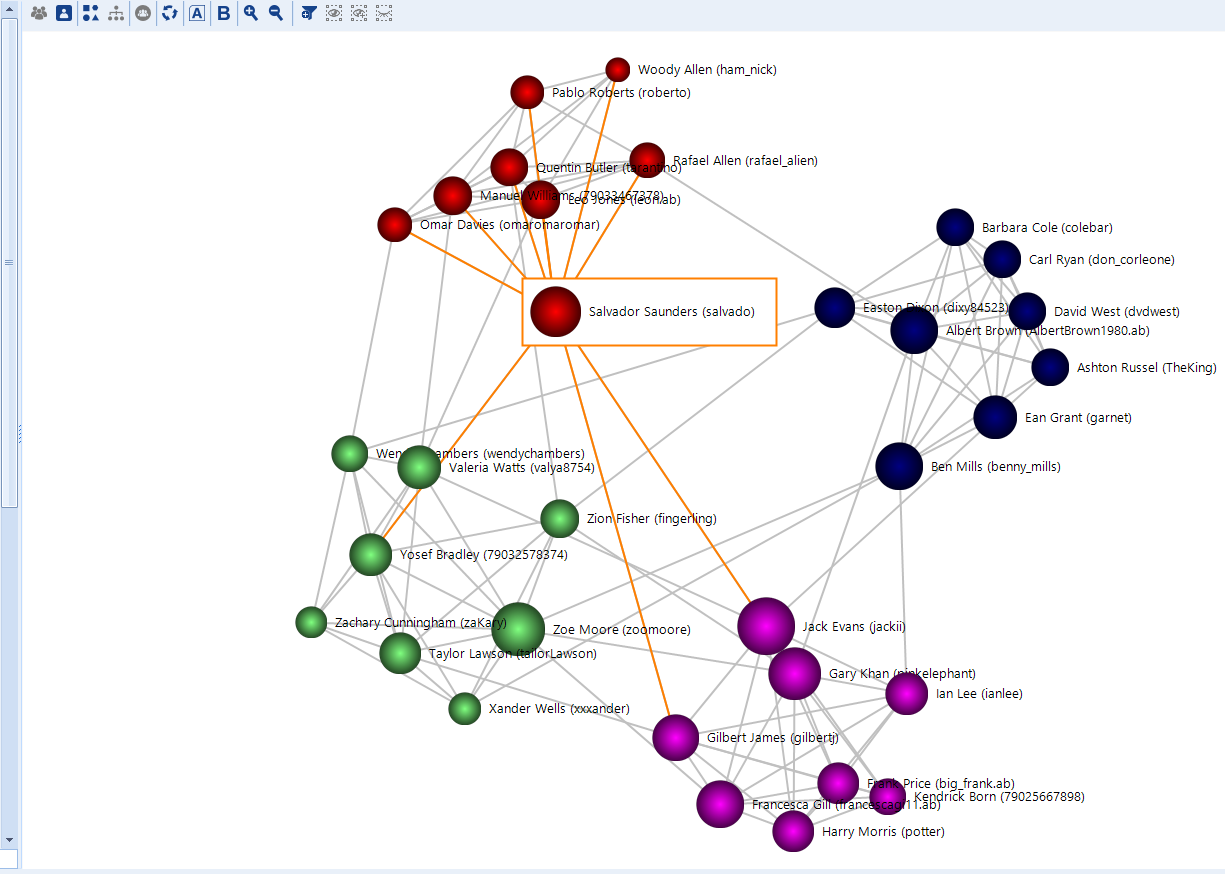
As you can see, the picture is complex. The picture our customer saw was also quite sophisticated, since several data sources, with numerous accounts and communication archives, were added to the case.
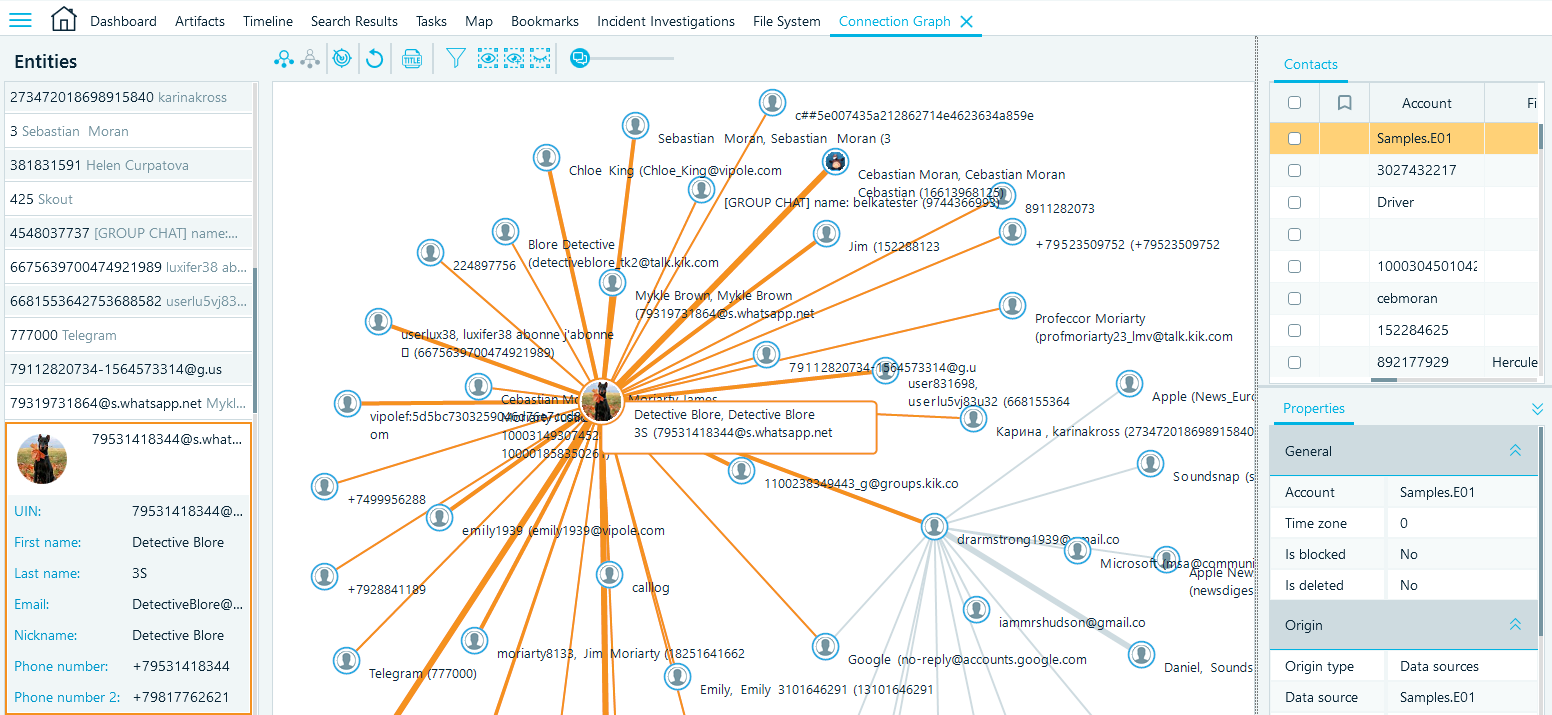
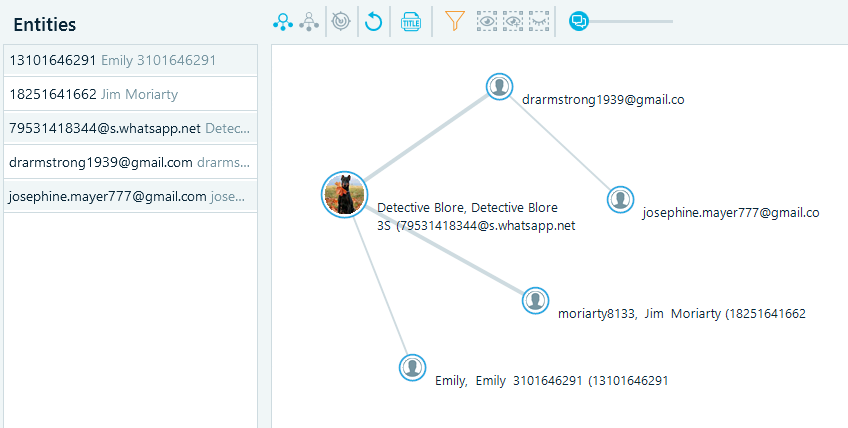
At the same time, if you take a closer look, the picture will be coherent and well-structured. The list of all persons associated with a case is shown in the left column. In the center, the graph itself is presented. Finally, if you click on any person at the left or any avatar in the middle, detailed information about the selected user will be displayed in the right pane. You can also select a connection; in this case, both persons, along with their communications, will be presented at the right.
Let us take a closer look at them.
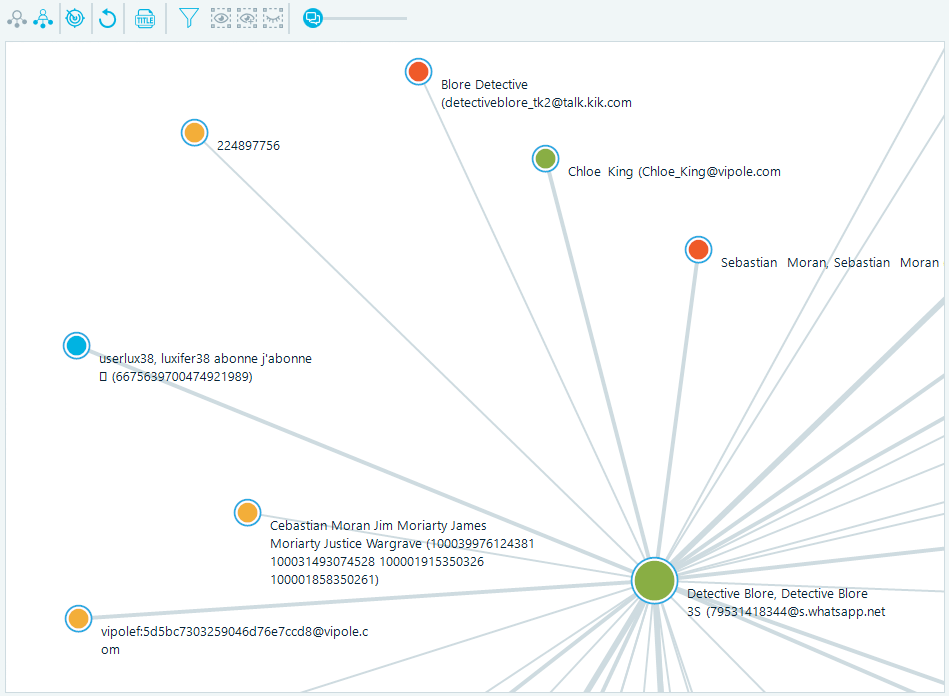
a. The first couple of buttons make it possible to view a case via avatars by default or via dots

If you choose to do so, you will see a picture like the screenshot below. The bigger a dot is, the more active it has been. As our customer pointed out, this function was of great importance to him, as it identified the key players in the fraudsters’ group.
b. Next button is also of particular interest to an investigator. It enables you to ‘Detect Communities’. As you can guess, Belkasoft X can examine case landscapes and ‘unite’ people who have communicated with each other in groups. In other words, it finds groups of tightly connected people who are likely to know each other very well.
As you can easily guess this function makes it possible, on the one hand, to identify circles of victims grouped around perpetrators as well as links between the perpetrators on the other hand.
c. The following control buttons include ‘Rebuild Layout’, which rearranges the angle of your view, ‘Show/Hide Weights’ which emphasizes and conceals the intensity of communications, and ‘Zoom In’/’Zoom Out’ (you can also use mouse wheel to zoom). When it comes to practical investigations, such ways of customization are useful in terms of reporting and presenting.

d. The next button is ‘Add Filters’: if you work with the Connection Graph, you can apply three filters including profiles, data sources, and contacts.

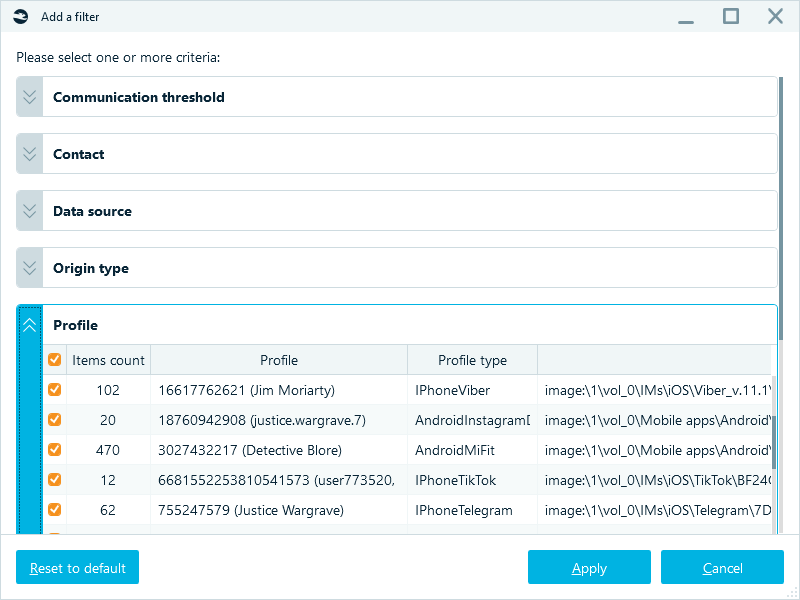
All these filters were actively used by the customer during the investigation. It was an inevitable problem because carding, as it is, supposes a lot of communications with several people. Each portion of it had to be examined, proven, and presented individually. At the same time, these portions were also to be examined in their entirety, as a sequence of repeated actors, patterns, and techniques.
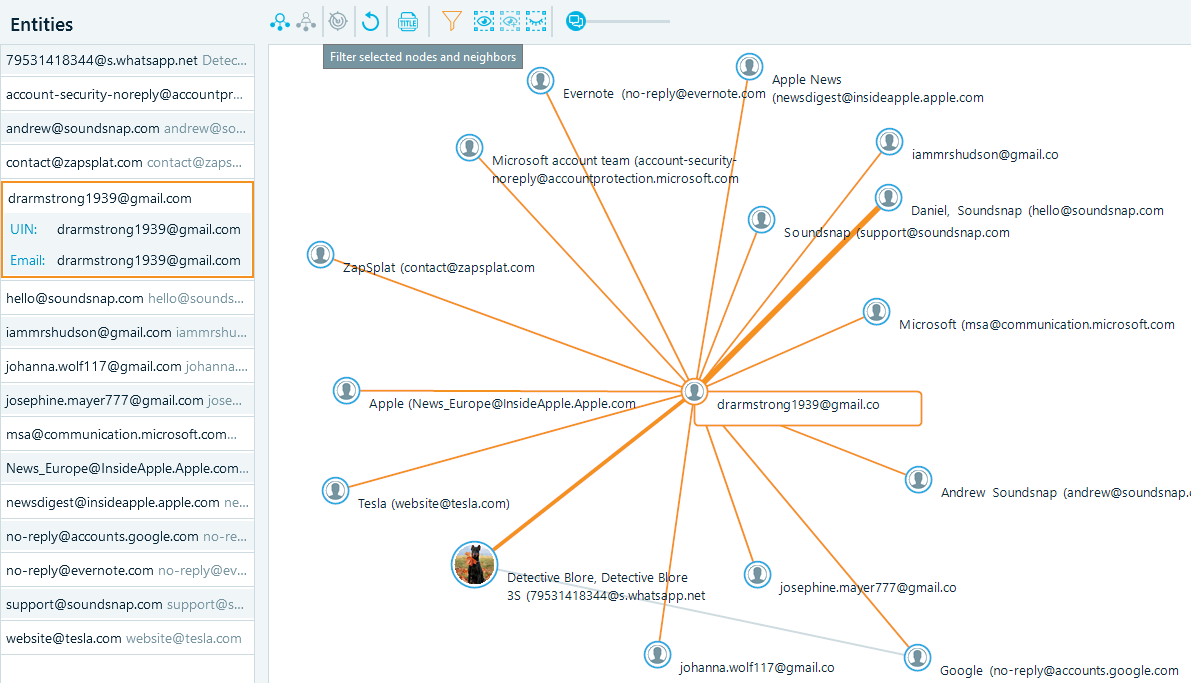
e. The next three buttons of Belkasoft Connection Graph are ‘Filter Selected Nodes’, ‘Filters Selected Nodes and Neighbors’, ‘Hide Selected Nodes’. These options made it possible to exclude all the irrelevant individuals (either as raudsters, or as victims, i.e. those not involved in the case). Without them the picture looked much more coherent and clearer.

If you click on ‘Filter Selected Nodes’ after you click on several profiles interest, you will ‘isolate’ them and discount their surroundings.
g. Clicking on ‘Filter Selected Nodes and Neighbors’ will ‘isolate’ and highlight not only a node of your choice, but also its communicative surroundings.
h. Finally, you can ‘Hide Selected Nodes’.
These three functions made it possible to get a clear picture, including the most likely ringleader, his associates and various ‘layers’ and ‘circles’ of victims.
Conclusion
Connection Graph built into Belkasoft Evidence Center X may be a handy tool for a digital investigator. You can easily visualize connections between participants of your case and customize such a visualization, take different angles, and the last but not the least, generate persuasive pictures as well as deep and extensive reports (by the way, you can generate a report easily, just click ‘Edit’, then ‘Generate report’). Whether you deal with a ring of sexual predators with multiple victims, secretive illegal organizations or a criminal association, this tool will be extremely helpful. As we have already stressed, this tool turned out to be extremely helpful while investigating a credit card fraud case.
You can:
As our customer told us, ‘initially the case looked like a real mess. The crime itself was not in particular sophisticated in technical terms. A group of people used several fake accounts and communication media to extort credit card data from gullible people. As simple as that. The true problem was the structure of the crime. More than that, as we found out, a lot of victims had not reported these crimes. So, it was also our objective to identify them. Regarding all these issues, such as identities, contacts, perpetrators and their leaders, patterns and countless interconnections, the Connection Graph by Belkasoft was invaluable’.
To sum up, in an extremely digitalized world any digital forensic expert should have a tool for showing high-level communications, especially for cases with multiple devices involved. You can try this tool anytime. 30-day free trial is available at belkasoft.com/get


Read more about Belkasoft capabilities here: