File System
File System window allows you to examine the file system of data sources, added to your case, including special and hidden files and folders. It can also visualize memory dumps, particularly showing you memory processes for a given RAM dump.
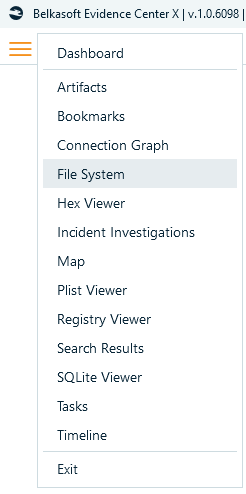
If you do not see File System window, you can show it by clicking on File System main menu item.
For data sources, which have file system inside, the product shows the file system contents even if you did not opt to analyze artifacts at the Add data source window. However, to see RAM processes, you will need to analyze the memory dump of interest and specify Extract processes option while adding a data source:
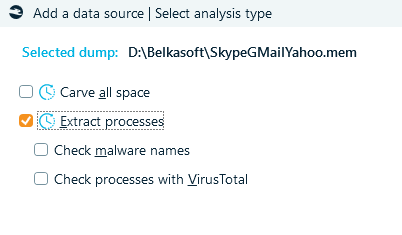
Note: This option slows down RAM dump analysis so do not select it if you only need to carve the dump for artifacts and are not interested in the process list.
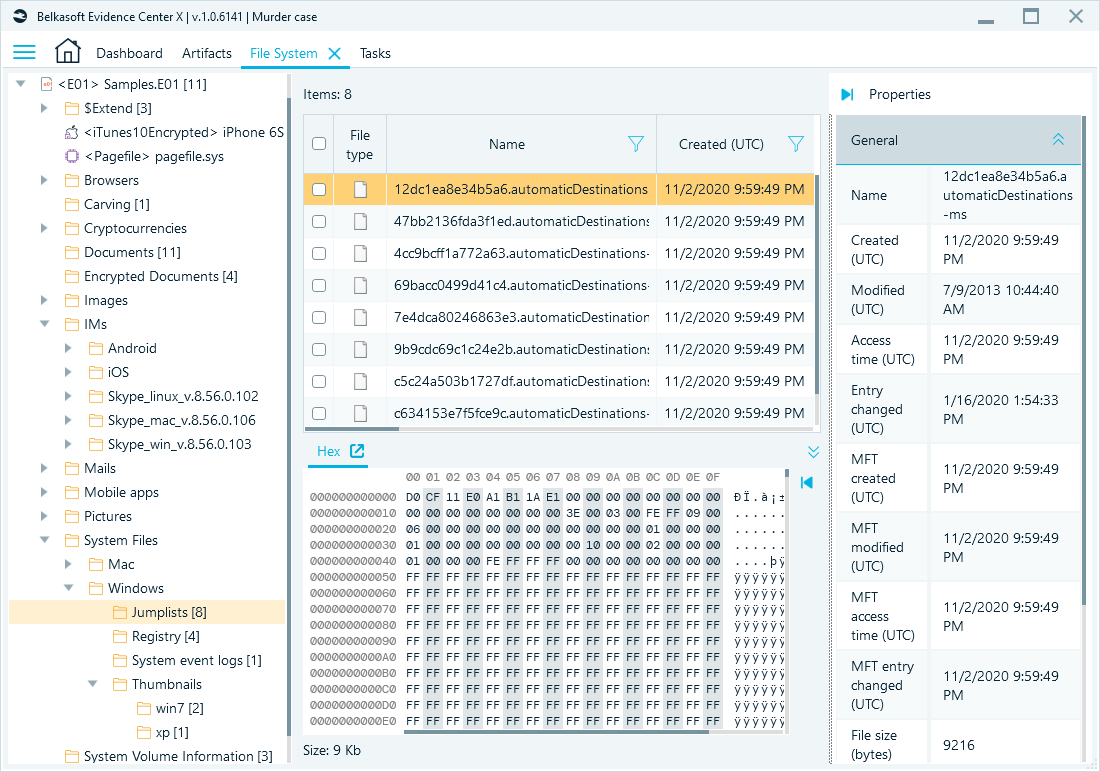
File System window is divided into four parts:
- Data source structure (pane at the left)
- File or process list (pane at the top center)
- Selected file in Hex or SQLite Viewers, if applicable (pane at the bottom center)
- Selected file details (pane at the right)
Data source structure
Data source structure pane is organized as a form of a tree view with the following nodes:
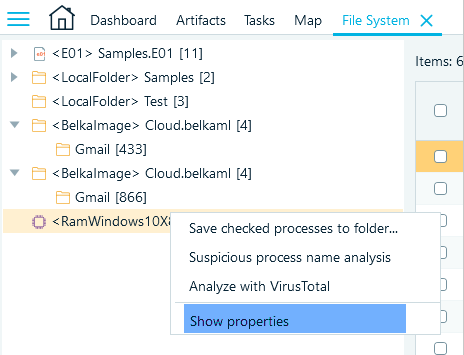
- Top level nodes are data sources added to your case using Add Data Source window. You can see type of data source in angle brackets preceding data source name. On the picture above you can see that "Samples" is of type "E01" and "iPhone 6S" is of type "iTunes10Encrypted" (encrypted iTunes backup). An icon at the left of data source name can also help to quickly classify the data
- Lower levels can be:
- Nested data sources (e.g. iTunes backup on the picture above)
- Volumes and partitions
- Folders
- Volume shadow copy snapshots
The number inside square brackets indicates the number of files located in this folder (no brackets mean no files, as, for example, for "Thumbnails" folder on the picture above). It does not include files in subfolders. For RAM dump, this number indicates the amount of processes recovered in this dump (shown only if you analyzed the dump with Extract processes advanced carving option switched on). When you select any folder, snapshot or RAM dump in data source structure pane, the corresponding item contents will be shown in the list at the right, such as subfolders, files or memory processes.
Data source structure context menu
When you right click on a node in the data source structure pane, a corresponding context menu will appear, which may contain some of the commands below:
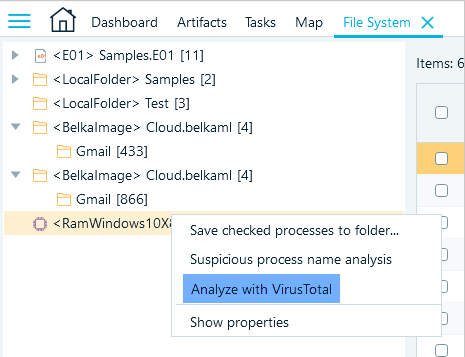
- Analyze with VirusTotal. This menu item is available for memory dumps with processes extracted by Belkasoft X. It will upload the entire memory contents for each process to VirusTotal and retrieve analysis result from there. Note: This function needs an Internet connection. Note: unlike for files, the entire process memory is uploaded since hash analysis is not applicable for memory. Analysis results will be then shown in the process list and process details panes.
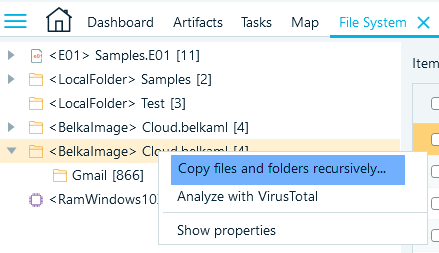
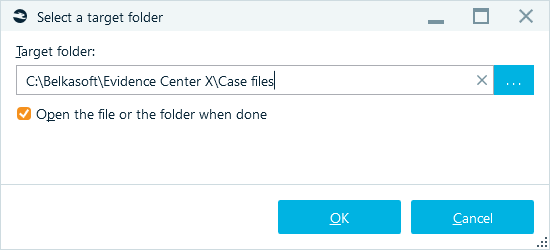
- Copy files and folders recursively… This menu item will copy files from a selected folder and its subfolders to your host machine folder.
-
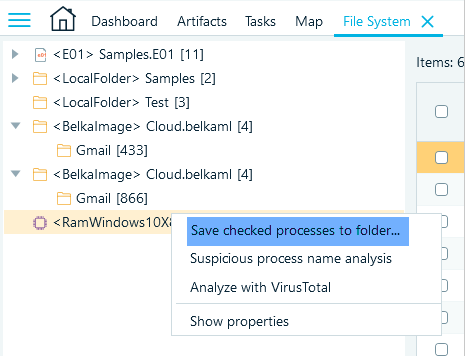
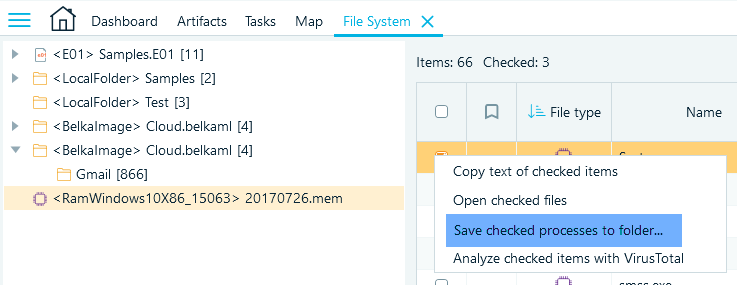
Save checked processes to folder… This menu item is available for memory dumps with processes extracted by Belkasoft X. It works similarly to Copy files and folders recursively menu with the only difference that it copies processes, not files.
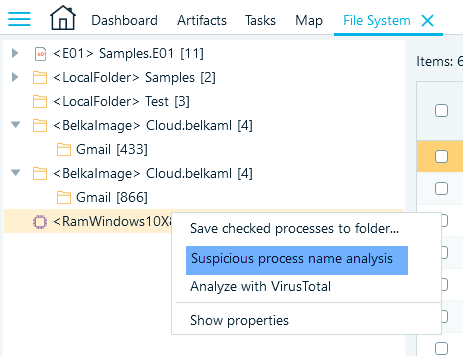
Suspicious process name analysis. This menu item is available for memory dumps with processes extracted by Belkasoft X. It checks names of extracted processes against a list of suspicious names, for example, scvhost.exe instead svchost.exe. The latter is a valid system process name while the former is a fake and, quite probably be malware.
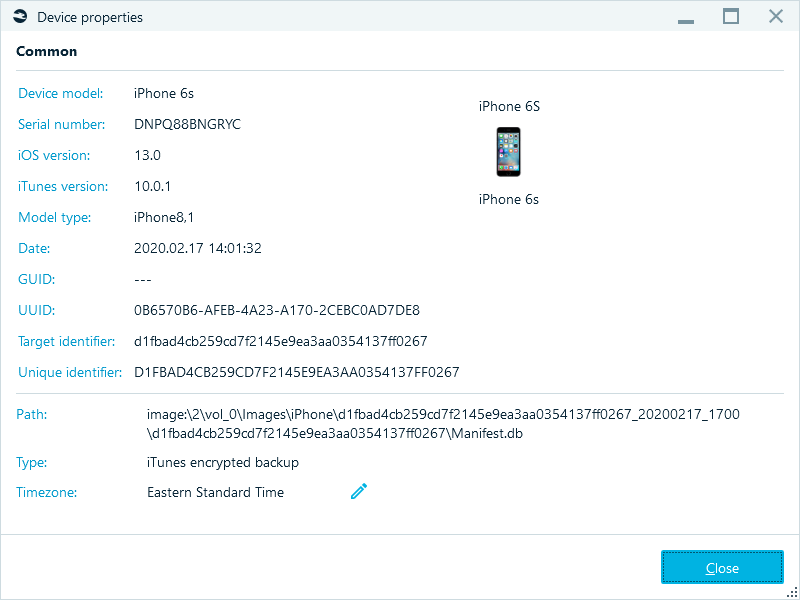
Show properties. This menu item is available for data sources and it opens Properties window. The set of properties displayed depends on the data source type. The window below shows properties of an iTunes backup, which include such information as Device model, Serial number, iOS version, etc.
File or process list
The pane at the middle of File System window is a list of items corresponding to the selection in the data source structure pane. These items can be subfolders and files (if a folder selected in the data source structure pane) or processes (if a RAM dump is selected and this dump was analyzed with Extract processes option).
Each list contains a checkbox for multi-item operations. There are various columns, including file or process name, times (such as Created, Modified or Last Accessed) and other properties of a file or a process. As in other lists, you can click on any column header to sort by this column value, and second click will reverse the sort order. Right click on any column header will allow you to choose columns to display, change column order or hide the selected column:

Right click on any column header and select Choose columns… context menu item to specify set of columns to show or change their display order
File or process list context menu
When you right click on an item in the file list pane or process list pane, corresponding context menu will appear, which may contain any of the commands below:
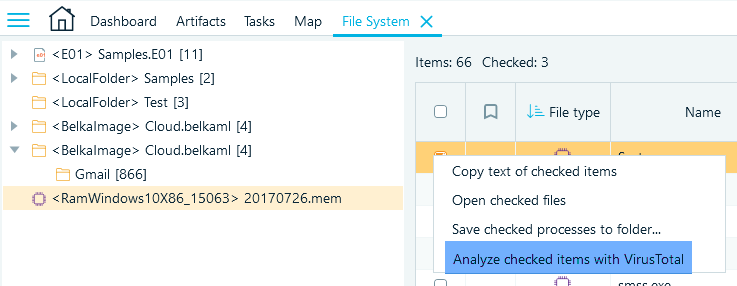
Analyze checked items with VirusTotal. This menu will upload the entire memory contents (if a process is selected) or a file hash (if a file is selected) for checked item to VirusTotal and retrieve analysis result from there.
Note: This function needs an Internet connection.
Note: Unlike for files, the entire process memory is uploaded since hash analysis is not applicable for memory. Analysis results will be then shown in the file or process list columns and details pane.
Copy files to folder… This menu item will copy checked files from the file list to your host machine folder.
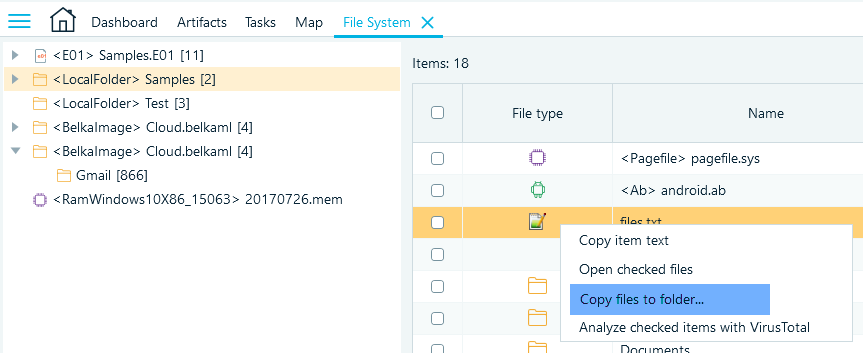
Copy item text / Copy text of checked items will copy all checked items along with visible properties, delimited by semicolon.
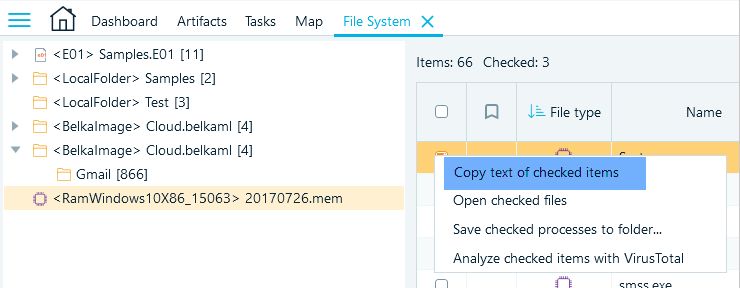
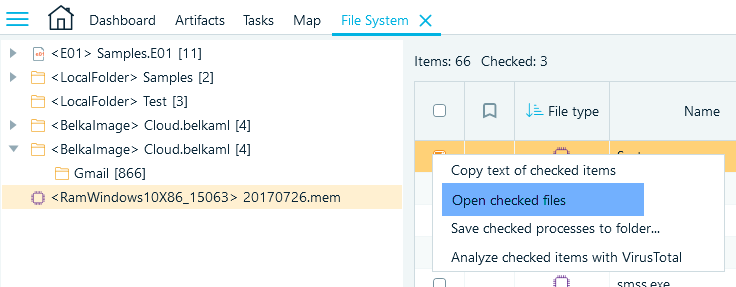
- Open file(s) / Open checked files menu will open checked files in default viewers such as a text or a document editor.
- Save checked processes to folder… This menu item is available for the process list. It copies checked processes’ memory to a selected folder on your host machine.
Selected file or process details
Once you selected a file or a process in the file list or the process list, its details will be shown at the right. You can see the file or process properties in this pane, such as name, timestamps, file size. Under the file or process list you could review the file or process contents inside Hex Viewer and other viewers depending on your selection.
The work with details pane is the same as in other artifact lists.
