Dashboard
Dashboard
Dashboard is the main product window. It is opened when you open or create a case. It has various actions about case and information on it.
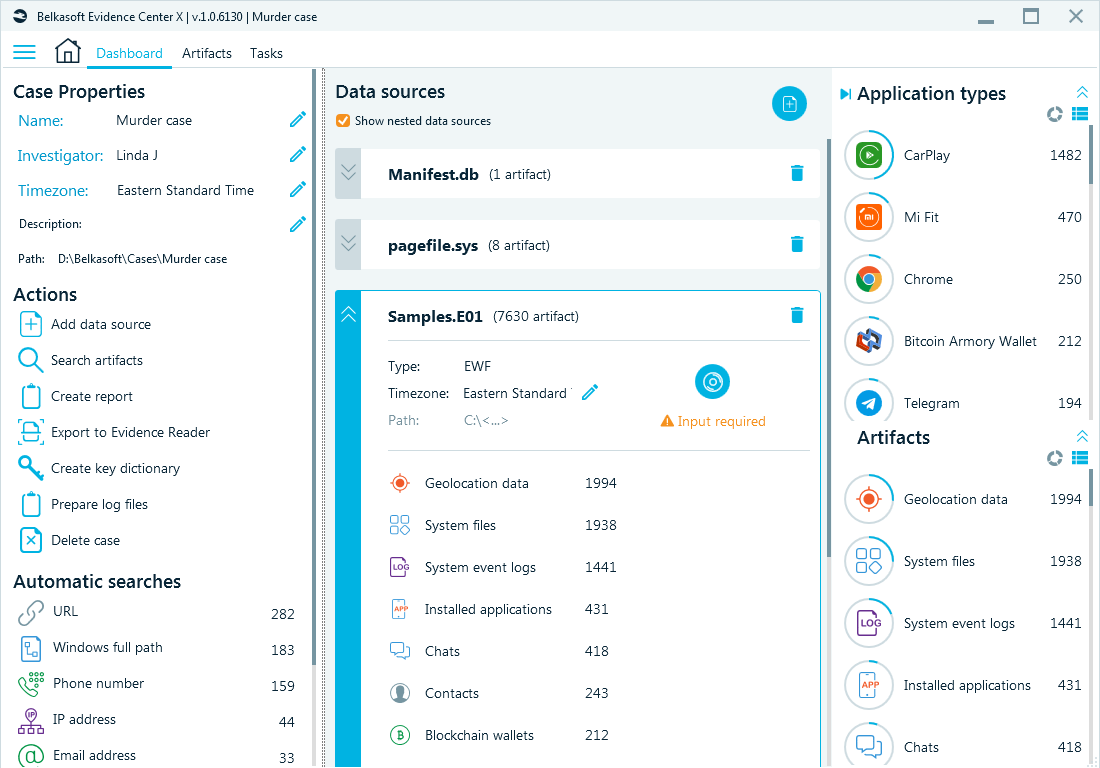
The window is divided into three panes: left, middle and right.
From the left pane, you can access:
- Case Properties
- Actions
- Automatic Searches
The middle part of Dashboard is devoted to data sources.
At the right, there are two graphs: most important applications sorted by number of artifacts extracted for each application, and most important artifacts. You can change the view for both graphs, from list to the pie chart. You can also collapse one or both, and you can collapse the entire panel to make more space for the data source part of the Dashboard. As with artifacts, you can double click on any item under each graph to navigate to the corresponding node in the Artifacts window.
See also:
Case Properties
Actions
Automatic searches
Data sources
Application types
Artifacts