By Emre Caglar Hosgor, SOC Analyst—Specially for Belkasoft
Introduction
Incident Response (IR) involves processes and technology for detecting and responding to cyber threats before, during, or after an incident. IR is an essential component of defensive cyber security. When we look at the chronological improvements, we see that the 1990s were the era of protection. By the 2000s, detection had gained importance. Recently, we have been aiming to combine protection, detection, and response against attacks. Computer forensics has followed a similar trend. In the 1990s, forensic investigation focused on protecting data and detecting cyber incidents. By the 2010s, response to events, root cause detection, and timeline analysis gained importance in Computer Forensics. All of these are essential parts of IR.
This article series will cover essential artifacts for IR and the use of Belkasoft Evidence Center X (hereinafter "Belkasoft X") by an incident responder. The first IR-related artifact to be discussed is the Windows event log files. Let us start with the structure of the artifact and computer forensic analysis for event logs.
What are Windows Event Files
In the Windows operating system, software and hardware incidents, errors, and bugs are stored in a central location that Microsoft refers to as an event log. The Event Viewer is the appropriate program to view default events in Windows OS.
Event logging mechanisms in Windows are structured into five major categories:
- Error
- Warning
- Information
- Audit Success/Failure
The configurations are in the Computer\HKEY_LOCAL_MACHINE\SYSTEM\CurrentControlSet\Services\EventLog registry key. This key contains subkeys for each configurable item in the event logging mechanism. For instance, the Computer\HKLM\SYSTEM\CurrentControlSet\Services EventLog\Application\Edge key is the configuration of the logging mechanism for the Microsoft Edge Browser. You can see the details of the registry structure of the logging mechanism on a Windows 11 machine in Figure 1:
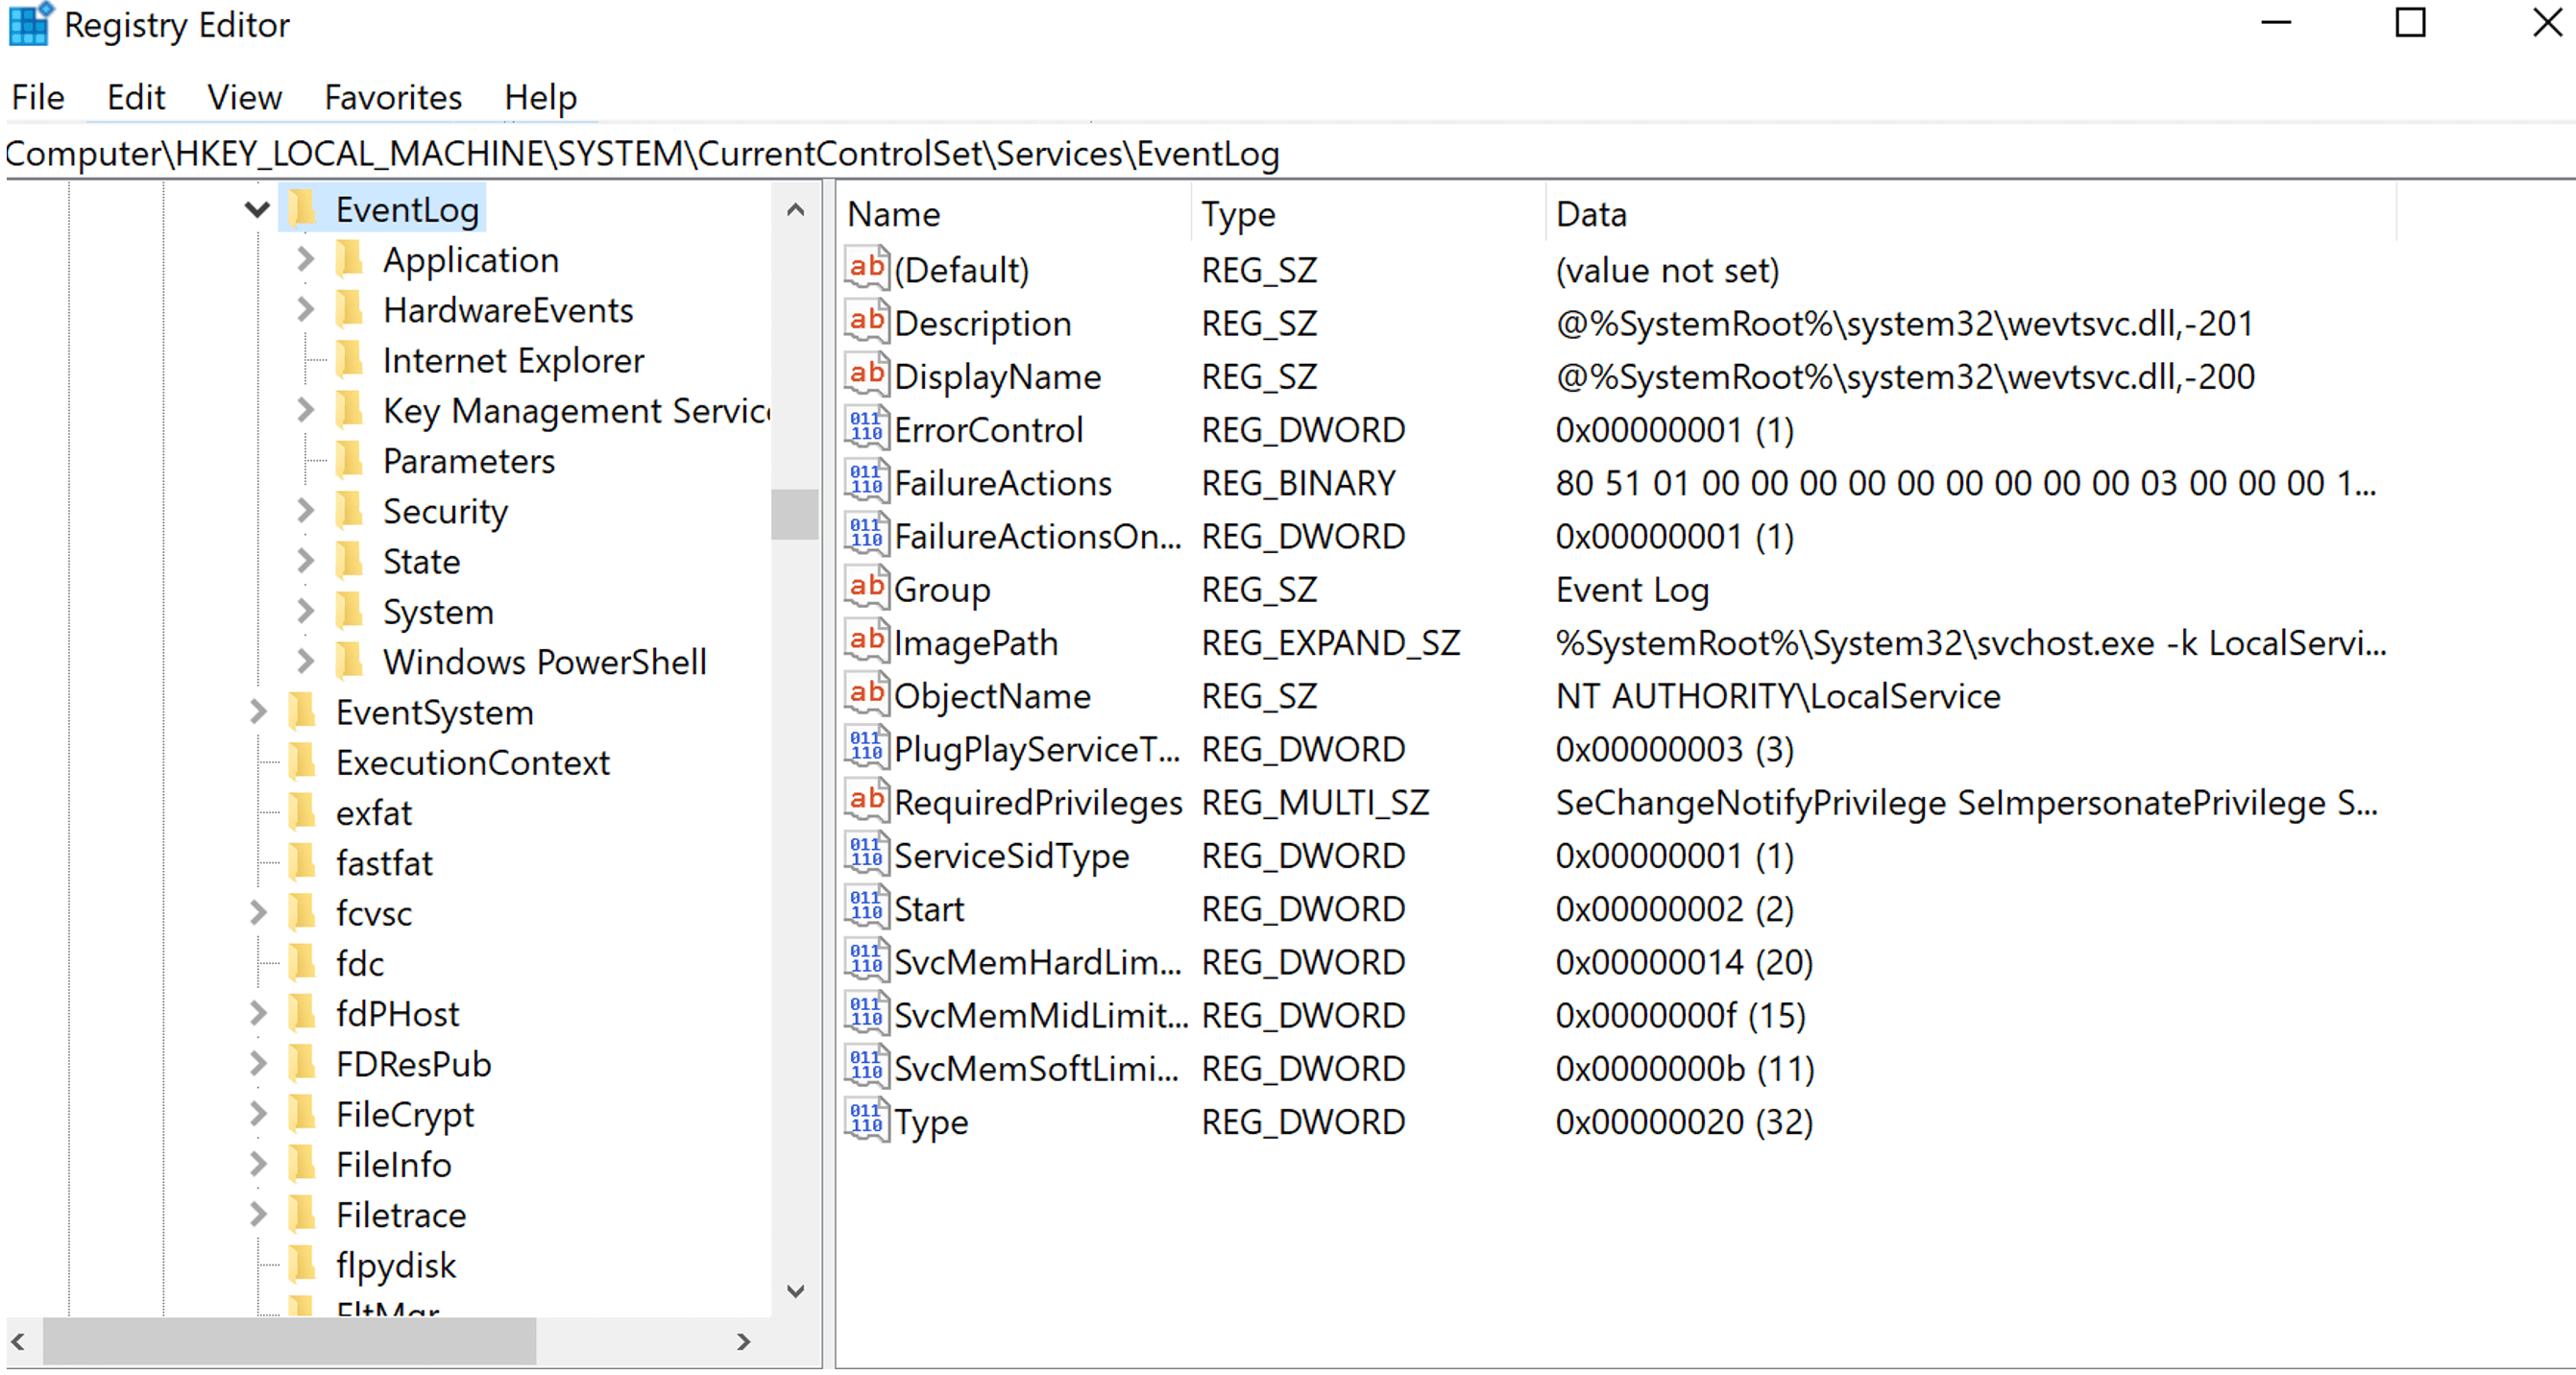
Figure 1. EventLog key in Window Server 2022
In addition to the keys above, domain controllers have DNS, Directory Service, and File Replication logs by default. Each EventLog key contains subkeys for event sources. The application event log is the most customizable, and the security and system are the least customizable event logs. For IR, the security event logs are the essential sources.
You can access and review Windows event log details using the Event Viewer application. By default, Event Viewer log files use the .evt or.evtx extension and are located in the C:\Windows\System32\winevt\Logs. However, you can move the log files to another location by using the Event Viewer or by specifying another default location in the Registry Editor.
The location of Windows event log files on Windows servers can vary depending on the version of Windows Server. For example, on Windows Server 2016, log files can be found in the C:\Windows\System32\winevt\logs folder. On other versions of Windows Server, you may find log files in a different location.
The locations for Windows event log files are:
- Windows Server 2019: C:\Windows\System32\winevt\logs
- Windows Server 2012 R2: C:\Windows\System32\winevt\logs
- Windows Server 2008 R2: C:\Windows\System32\winevt\logs
- Windows Server 2003: C:\Windows\System32\config
Event Logs for Incident Response
Event logs for incident response, by default, originate from security events. Only Local Security Authority (Lsass.exe) has permission to write security events. Security events can be structured via local or domain group policies. User account-related privilege escalation events are default logged under the security events. For the sake of brevity of the discussion, we will go over the essential event IDs about IR and Computer Forensics in security event logs. The detailed list can be found at the following link.
The most common security events are listed in Table 1:
|
Event ID |
Description |
| 4697 | A service was installed in the system |
| 4698 | A scheduled task was created |
| 4699 | A scheduled task was deleted |
| 4702 | A scheduled task was updated |
| 7045 | A new service is created on the local Windows machine. |
| 7034 | The service terminated unexpectedly |
| 1102 | Whenever Windows Security audit log is cleared, event ID 1102 is logged |
| 104 | This event is logged when the log file was cleared |
| 4776 | The domain controller attempted to validate the credentials for an account |
| 4771 | Kerberos pre-authentication failed |
| 4768 | A Kerberos authentication ticket (TGT) was requested |
| 4624 | An account was successfully logged on |
| 4625 | An account failed to log on |
| 4634, 4647 | User initiated logoff, an account was logged off |
| 4648 | A logon was attempted using explicit credentials |
| 4672 | Special privileges assigned to new logon |
| 4720 | A user account was created |
| 4722 | A user account was enabled |
| 4724 | An attempt was made to reset an accounts password |
| 4728, 4732, 4756 | Group membership changes |
| 5140 | A network share object was accessed |
| 5145 | Network share object was checked to see whether the client can be granted desired access |
How to Analyze Event Files with Belkasoft X
Belkasoft X can analyze event logs in detail. First, whilst adding a data source, you should select System event log artifact (or just select all supported artifacts):
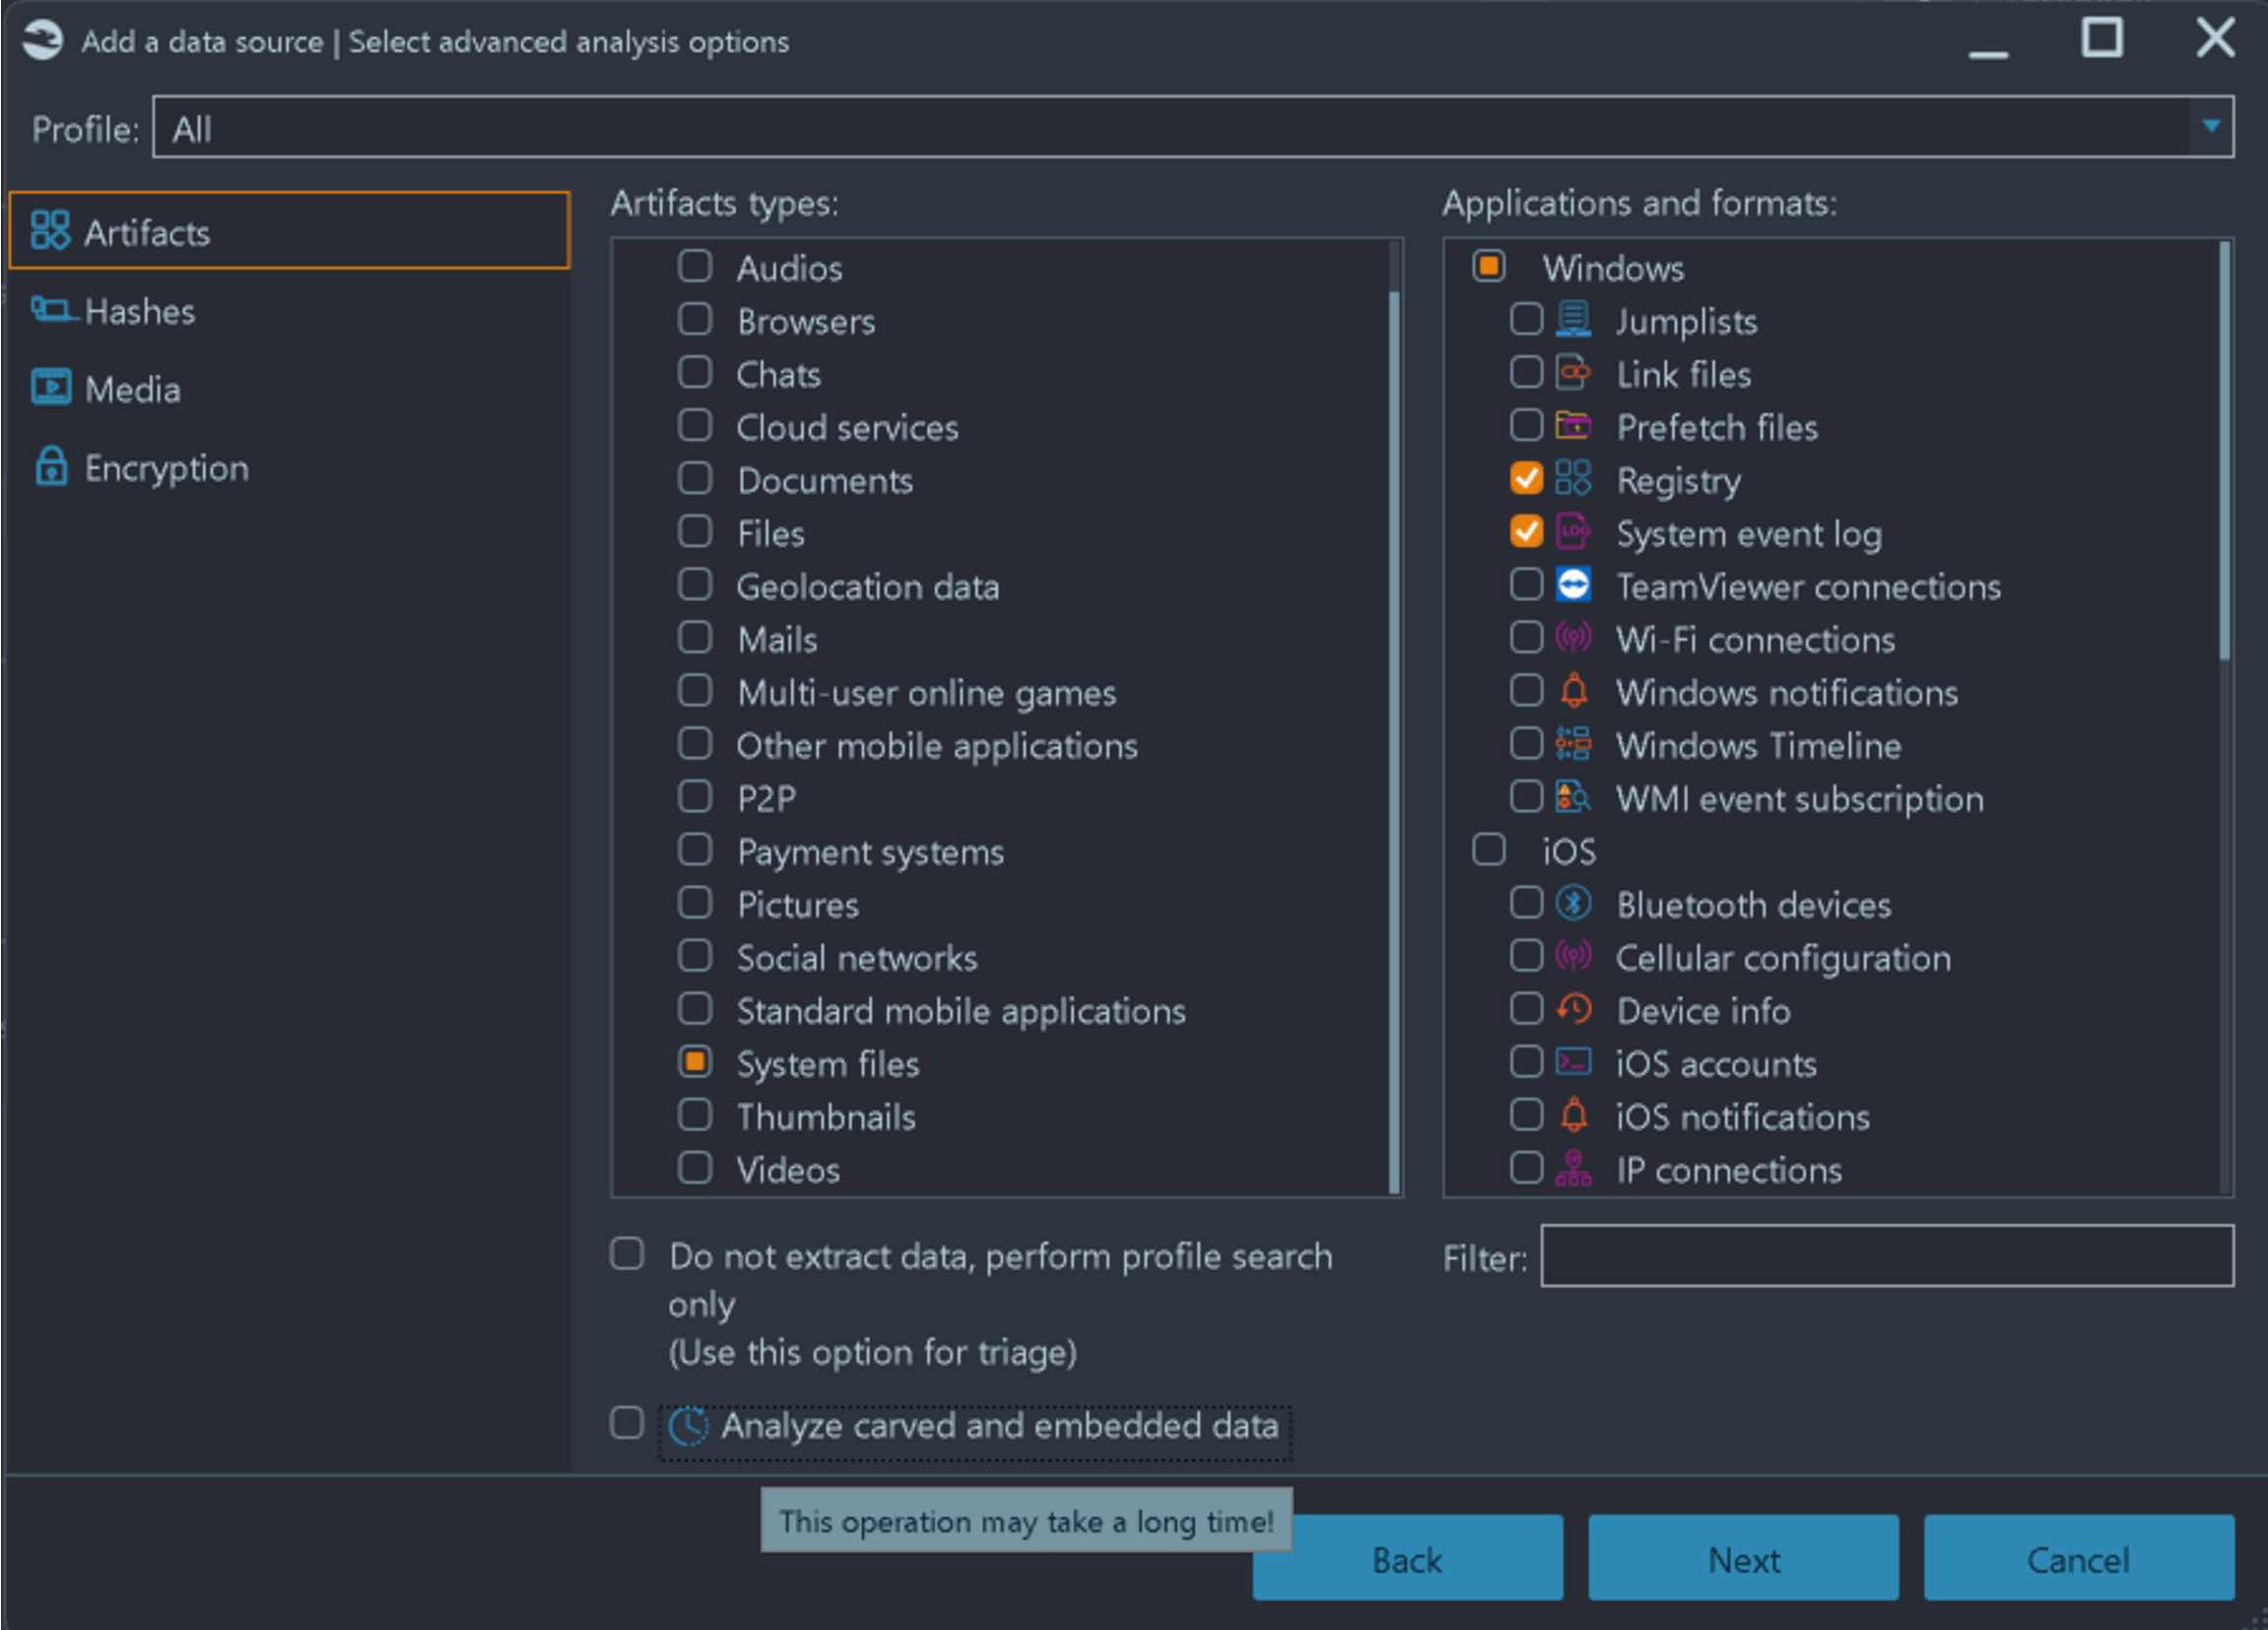
Figure 2. Adding Event Logs in Belkasoft X
Note that this will not only schedule searching for .evt and .evtx files but will also carve them, in case you selected carving for the data source analysis on the previous page of the Add data source sequence.
Once the analysis is completed, you can see the stats on every artifact, including event logs, on the dashboard. By clicking on the "System event logs", you can quickly start analyzing the events collected, parsed, and generated from the image. Figure 3 shows the dashboard after a successful analysis of the event logs:
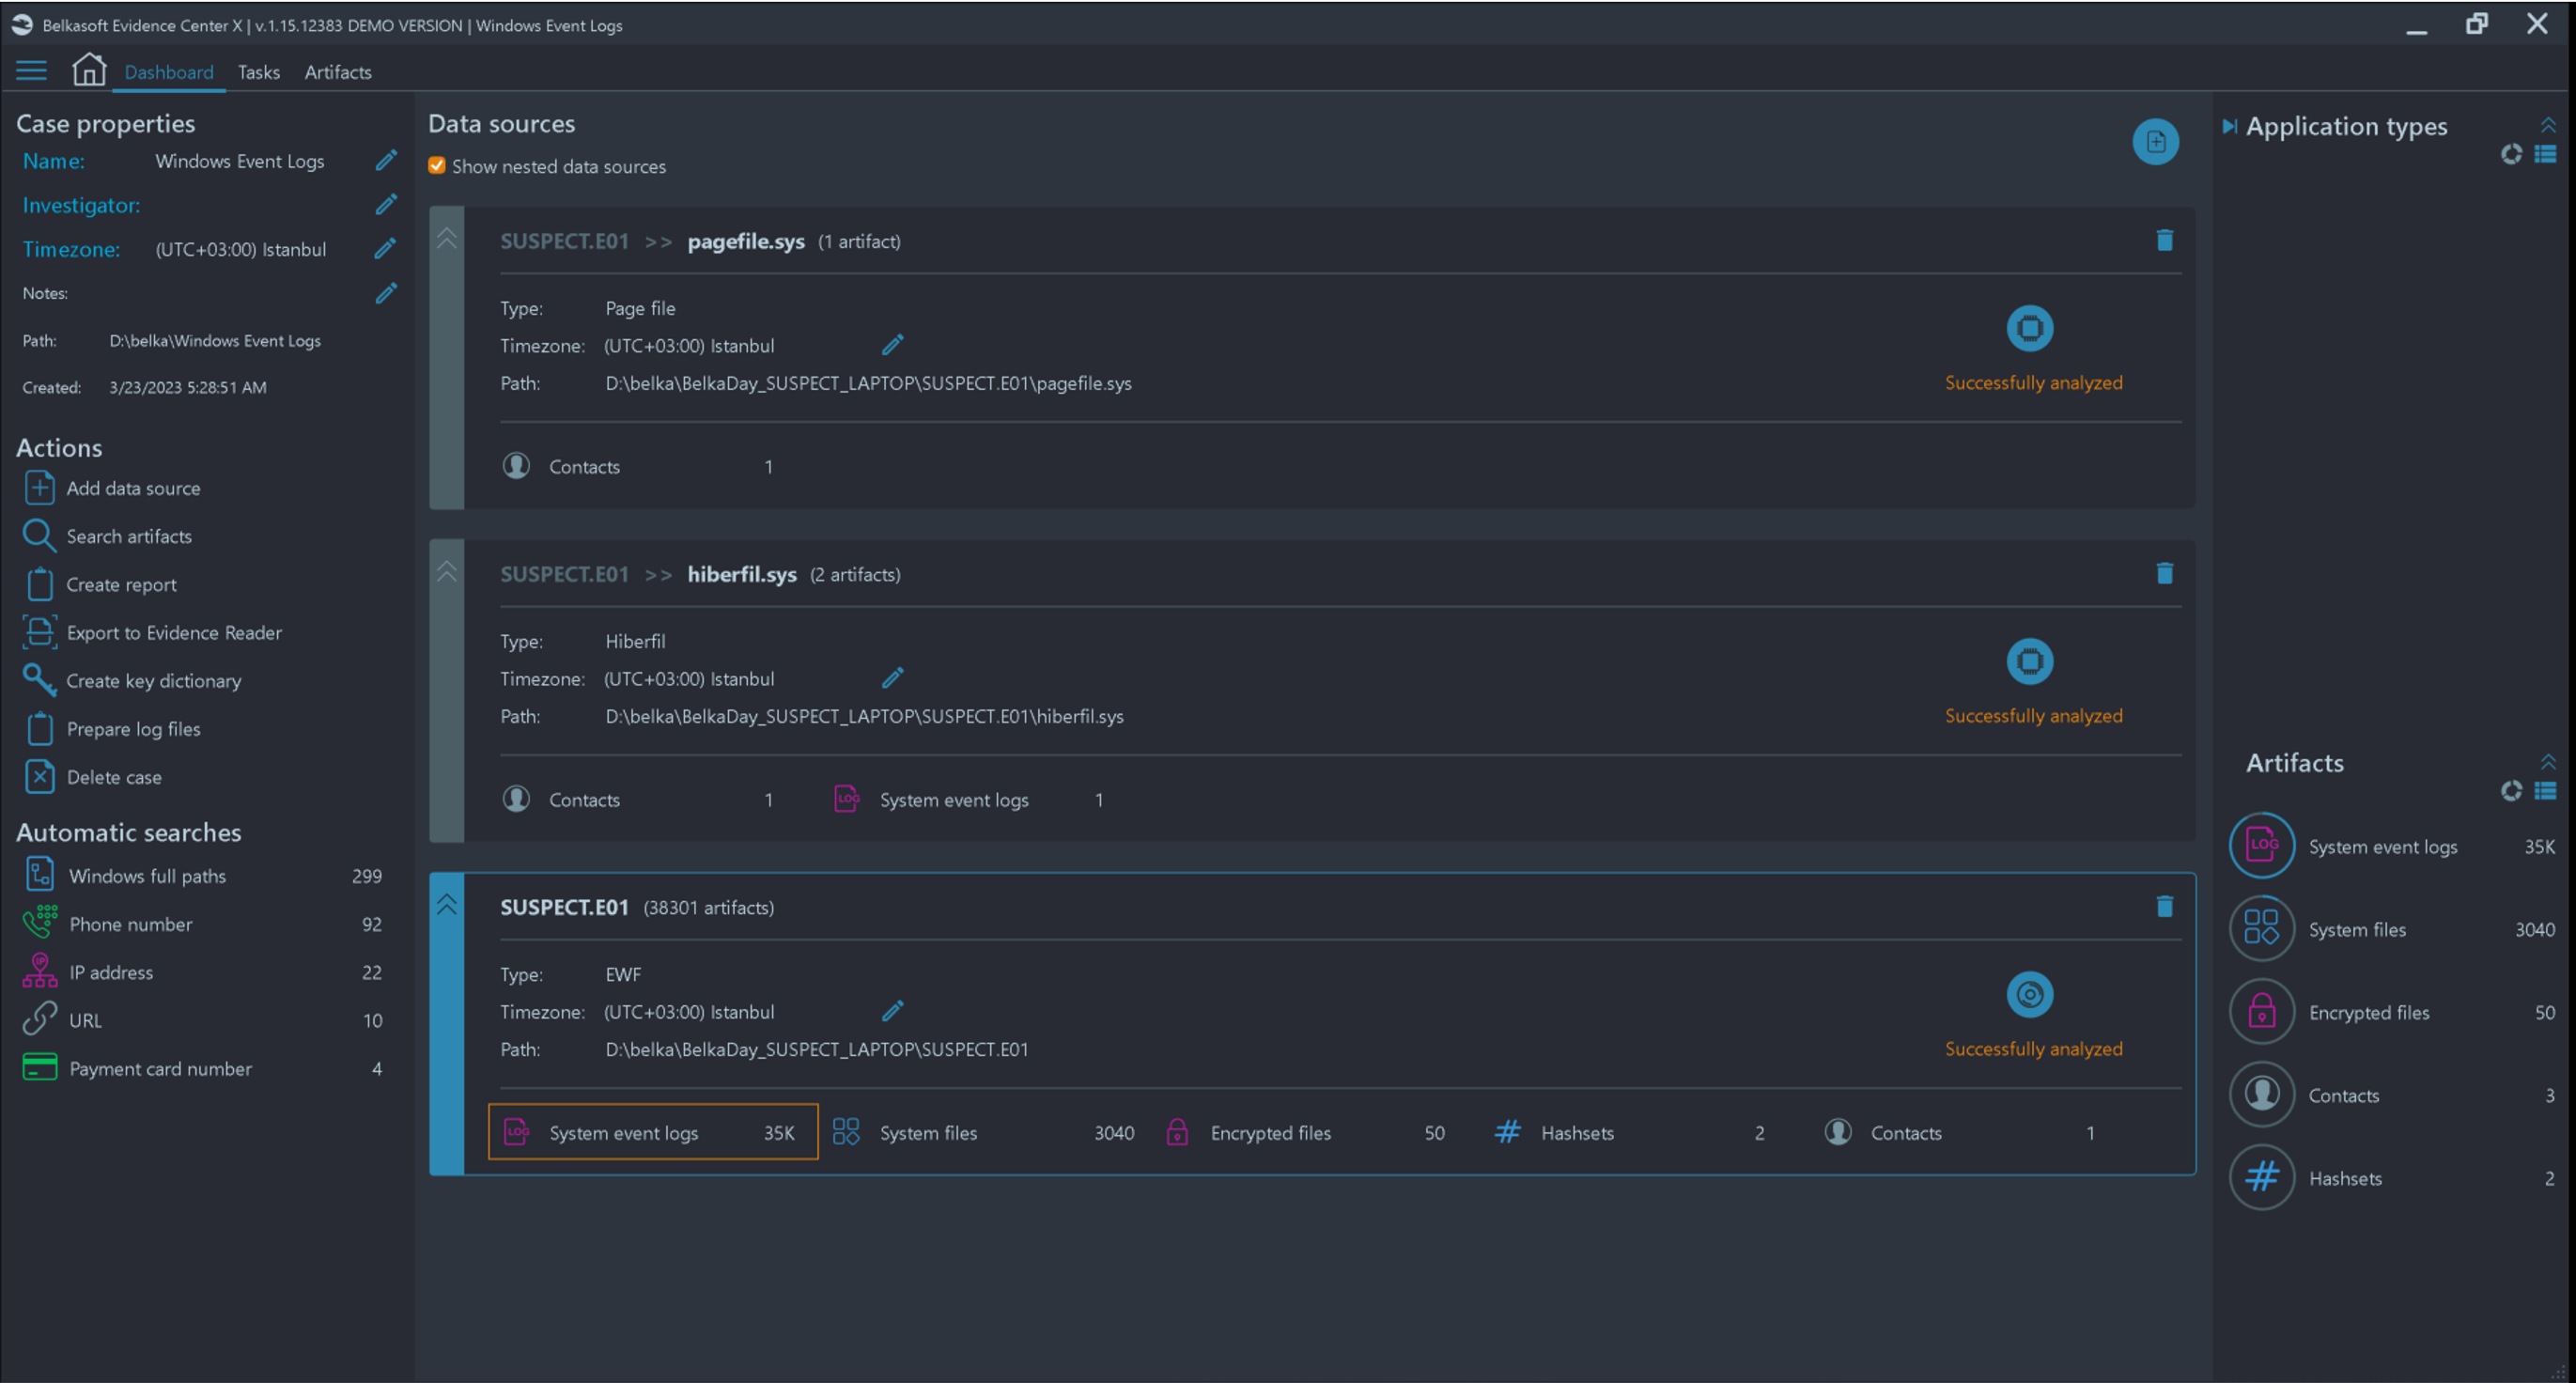
Figure 3. Dashboard View After Adding the Data Source to Belkasoft X
For a detailed review, you can open the Artifacts window of the product and navigate to the System event logs node. Figure 4 shows the event details on the Artifacts window:
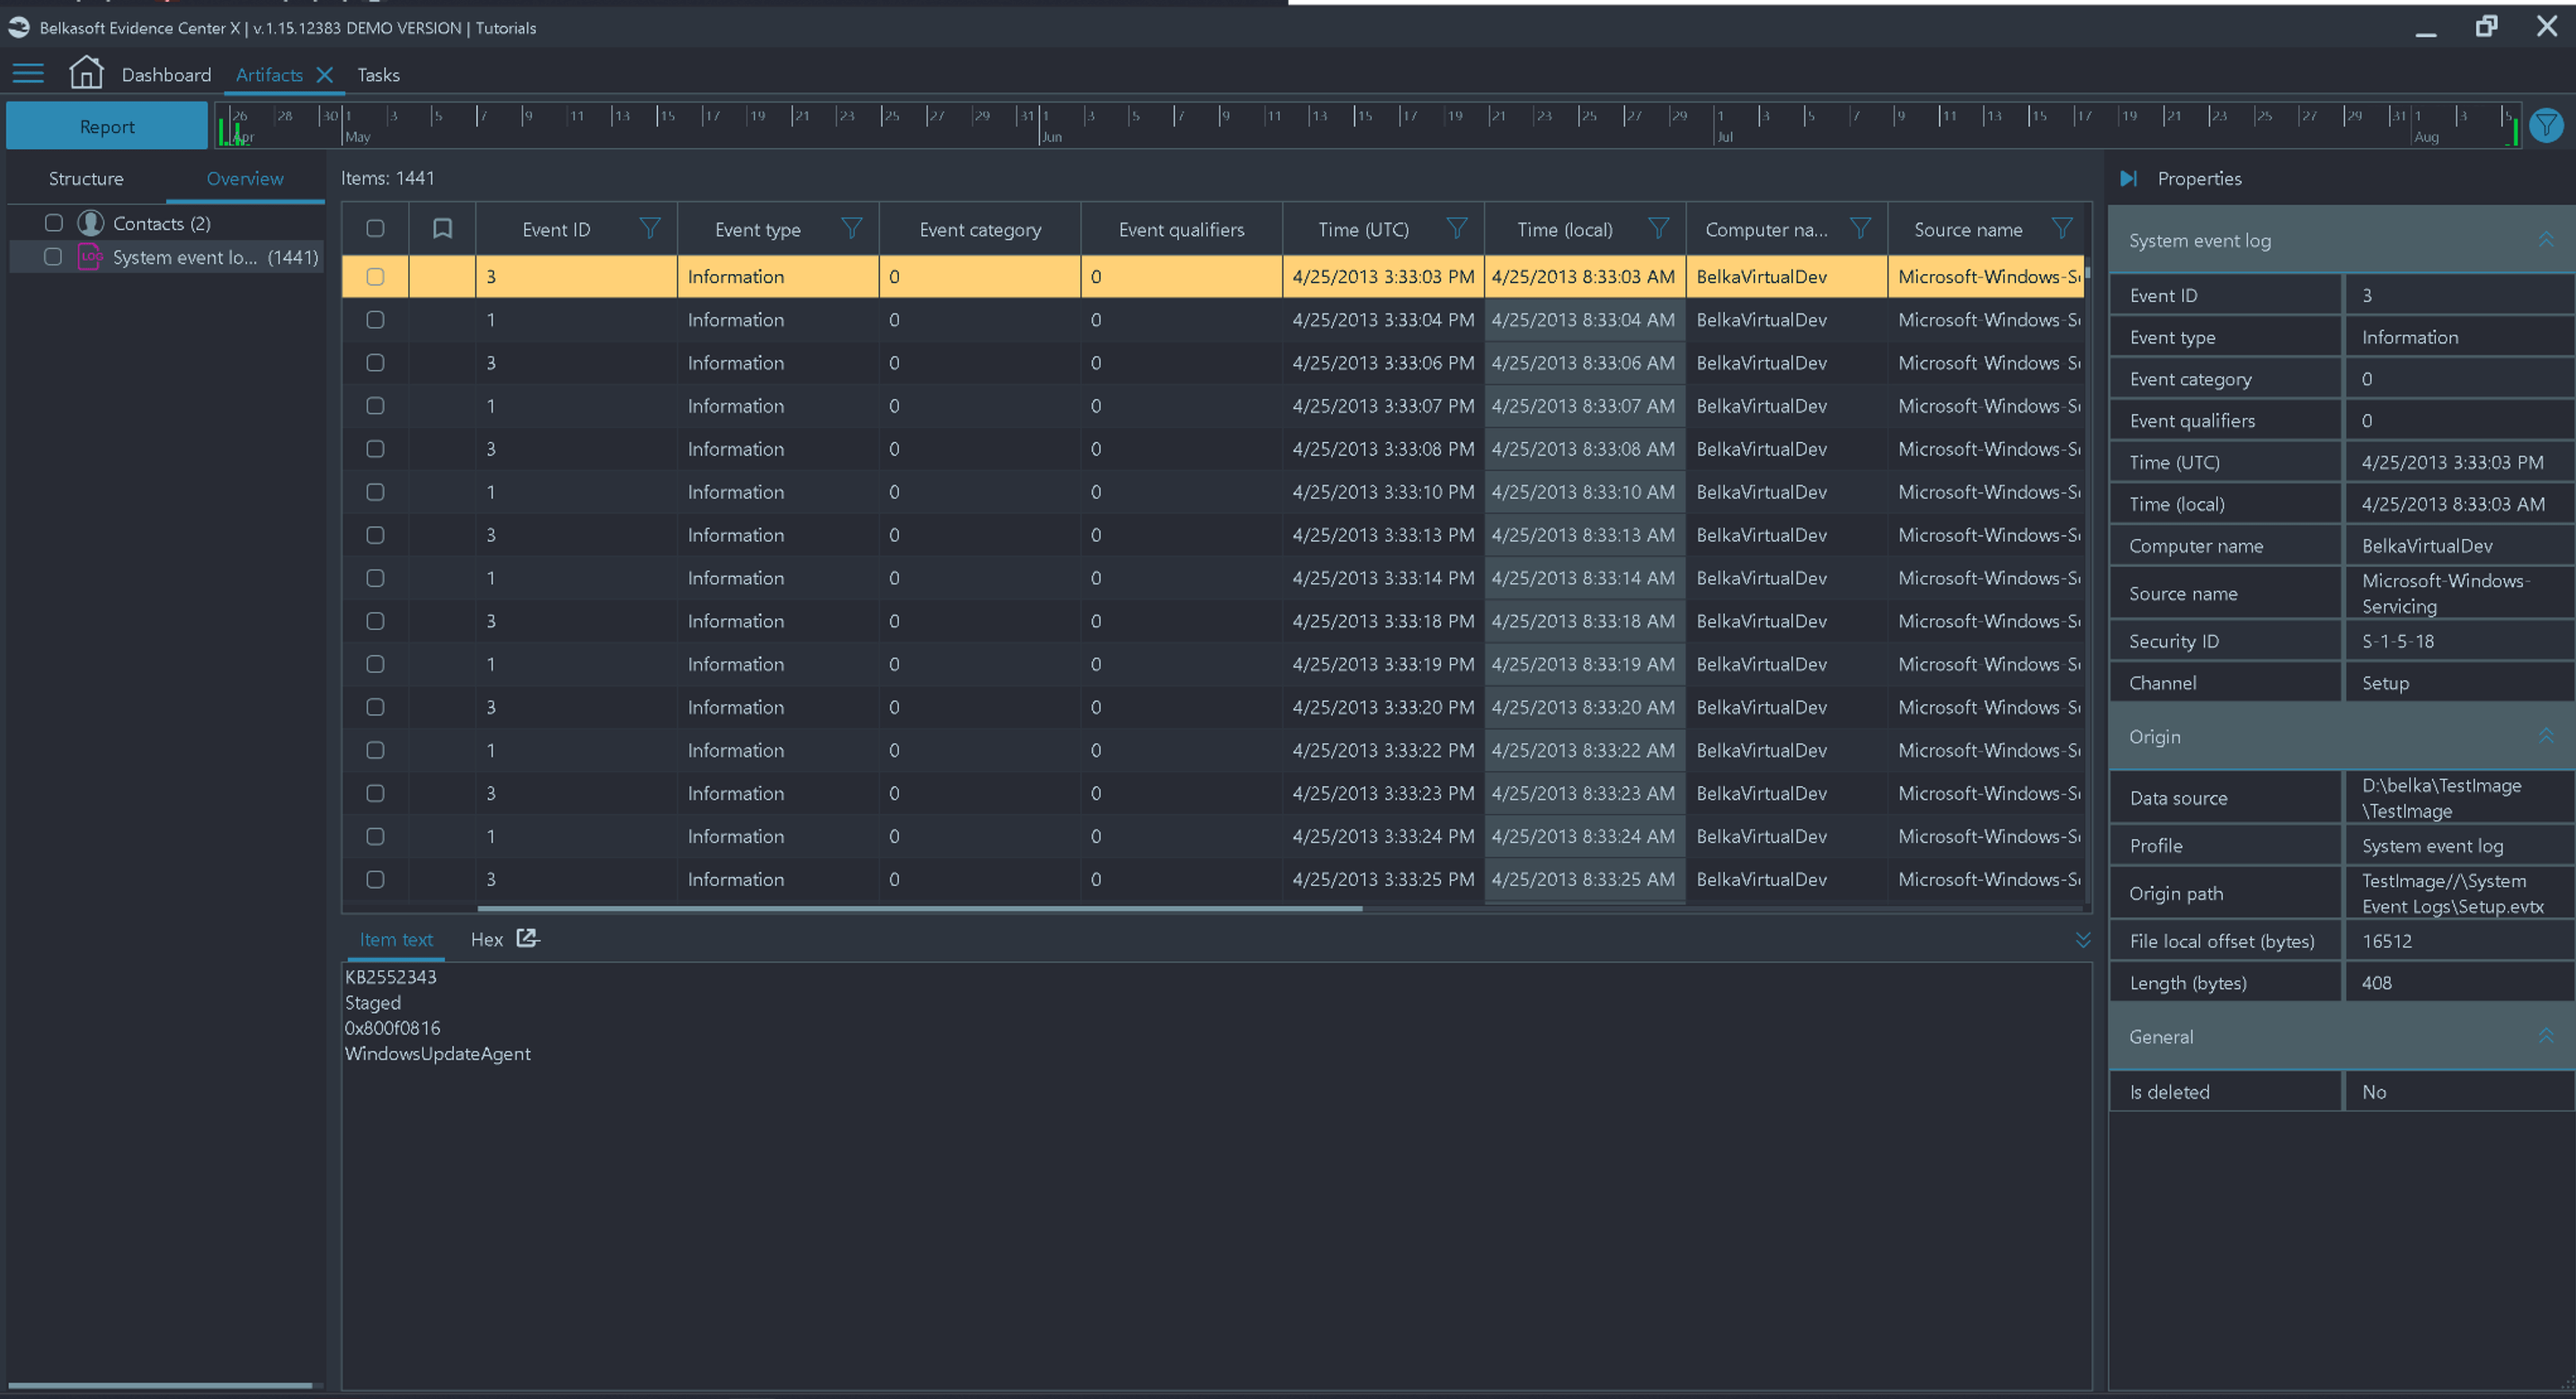
Figure 4. Analyzing Event Logs using Belkasoft X
Belkasoft X can filter events by various criteria, including Event ID, Security ID, Event type and time, source, and others. During an IR, those filtering options are vital to focus on only relevant events since a typical event log contains thousands, if not tens of thousands, of records.
Conclusion
The Windows Event Log is one of the most important data sources for incident response. There are a number of standard log files, as well as custom event log types, which you can expect inside a Windows device. Depending on the Windows version, event logs are stored in .evt or .evtx files.
Belkasoft X allows to extract, carve, analyze and visualize event details on a target system during a cyber incident response. A set of basic filters helps you to decrease the number of events to analyze. This article gives you a hint of which event numbers you might be interested in. For the following articles we continue our computer forensic focused IR journey. We are going to dive deep into logging mechanisms, detection methods, incorporating SIGMA and YARA rules into DFIR and many more.
