Windows Event Log Forensics: Techniques, Tools, and Use Cases
Windows event logs capture system activities, security events, and application behaviors. Digital forensic investigators and cyber incident responders utilize these logs to track user actions, identify unauthorized access, and reconstruct incidents. Given the enormous volume, manual analysis becomes impractical without effective tools and filters.
Read on to learn about:
- Windows event logs and their challenges in digital forensics
- How to choose the right tool for Windows event log analysis
- How to streamline investigations with Sigma rules
- Common use cases to explore in event logs
Discover how Belkasoft X enhances your Windows event log forensic analysis beyond basic parsing.
Windows event logs in digital forensics
Windows event logs store system events, security alerts, and application-specific logs, and can include important evidence for cyber incident investigations.
Storage and structure
Logs reside in .evtx files ( .evt in older Windows versions) located in C:\Windows\System32\winevt\Logs. Windows maintains five primary logs:
- Security log: Tracks authentication attempts, privilege usage, and policy changes.
- System log: Captures operating system issues, such as service failures or driver errors.
- Application log: Contains application-specific messages.
- Setup log: Records installation and update events.
- Forwarded events log: Collects logs from remote computers.
Beyond these core categories, additional logs include:
- Operational logs:
Many Windows components maintain operational logs that track internal processes and activities. Examples include:
- Windows Defender log (Microsoft-Windows-WindowsDefender%4Operational.evtx)
- Terminal Services activity log (Microsoft-Windows-TerminalServices-LocalSessionManager%4Operational.evtx)
- Group Policy changes (Microsoft-Windows-GroupPolicyr%4Operational.evtx).
- Performance diagnostics logs (Microsoft-Windows-Diagnostics-Performancer%4Operational.evtx).
- Administrative logs: These logs capture events intended for administrators, such as critical issues or configuration problems. File names typically end with %4Admin.evtx
- Custom logs: Administrators or security tools may configure custom logs to capture specific types of events not recorded in default logs.
Many of these logs exist by default but remain inactive unless triggered. Nonetheless, depending on system activity and logging settings, some can provide additional details. Two typical examples of such logs will be PowerShell and Windows Defender operational logs:
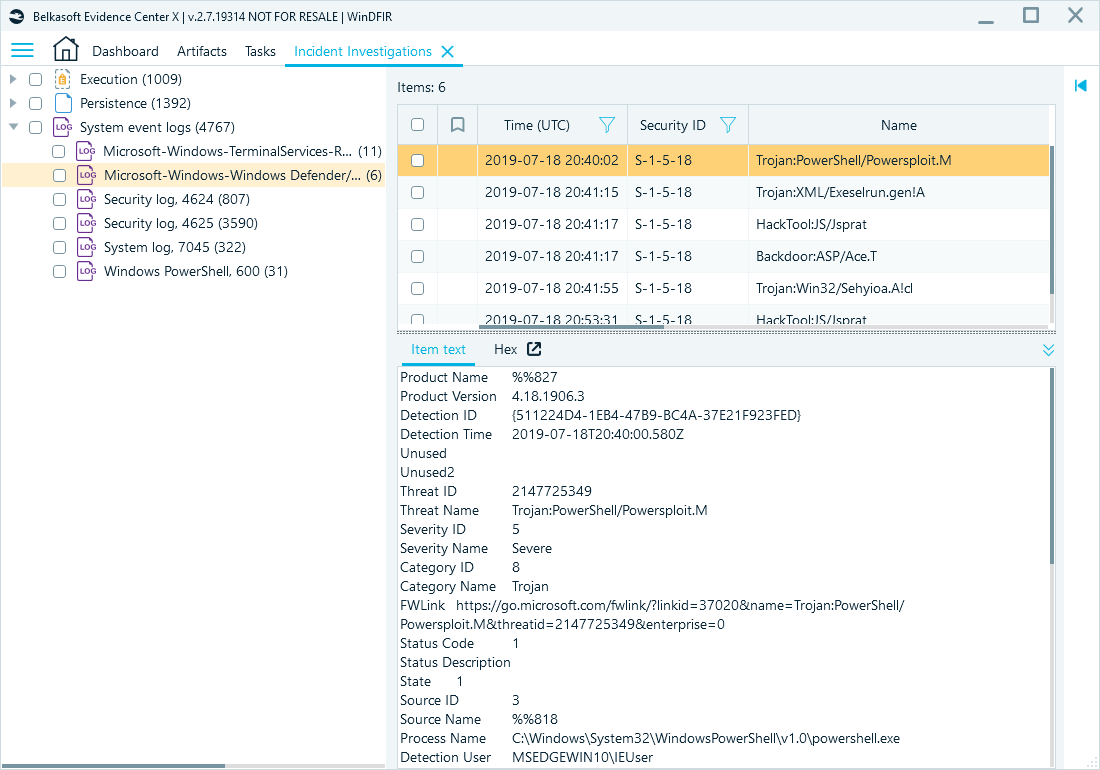
Reviewing Windows Defender logs in Belkasoft X's Incident Investigations window
Log entries typically contain:
- Event ID: A unique identifier for the specific event; categorizes the type of event and determines its description format.
- Timestamp: When the event took place.
- Source: The service, application, or system component that triggered the event.
- User: The account used to execute the event.
- Log Level: Severity classification (Information, Warning, Error, Critical).
- Message: Contextual details about the event.
Common challenges in event log analysis
Windows event log analysis involves several challenges:
- Volume and noise: Systems generate vast amounts of log data, making it difficult to isolate relevant events. Effective filtering and parsing are necessary to extract meaningful information.
- Numerous sources and event types: Windows logs contain thousands of event IDs, each representing a different system activity. However, the message format varies between event types, making consistent parsing challenging. Some messages follow a structured format, while others include unstructured text, requiring manual review or additional parsing to extract relevant details.
- Retention and overwriting: Logs have size limits defined by the system or configured by an administrator. When the limit is reached, older entries are overwritten. Some logs, however, may contain deleted or archived records that are not immediately visible.
- Corruption and gaps: Logs may become corrupted due to system crashes, sudden shutdowns, or malicious tampering. Gaps may occur due to system downtime, crashes, or time adjustments, requiring cross-referencing logs with registry and filesystem artifacts.
- Timestamp inconsistencies: When systems rely on different or misconfigured Network Time Protocol (NTP) servers, events from various sources may appear out of sequence, complicating incident reconstruction and analysis.
Windows event log analysis tools
The first step in analyzing Windows event logs for forensic purposes is to locate the relevant data, which can be challenging because event log files contain an enormous volume of forensic artifacts.
Windows native tools
Windows provides several built-in tools for viewing and analyzing event logs, such as Event Viewer, PowerShell, and LogParser.
Windows Event Viewer is a native Microsoft Management Console application that allows you to open and inspect any Windows event files:
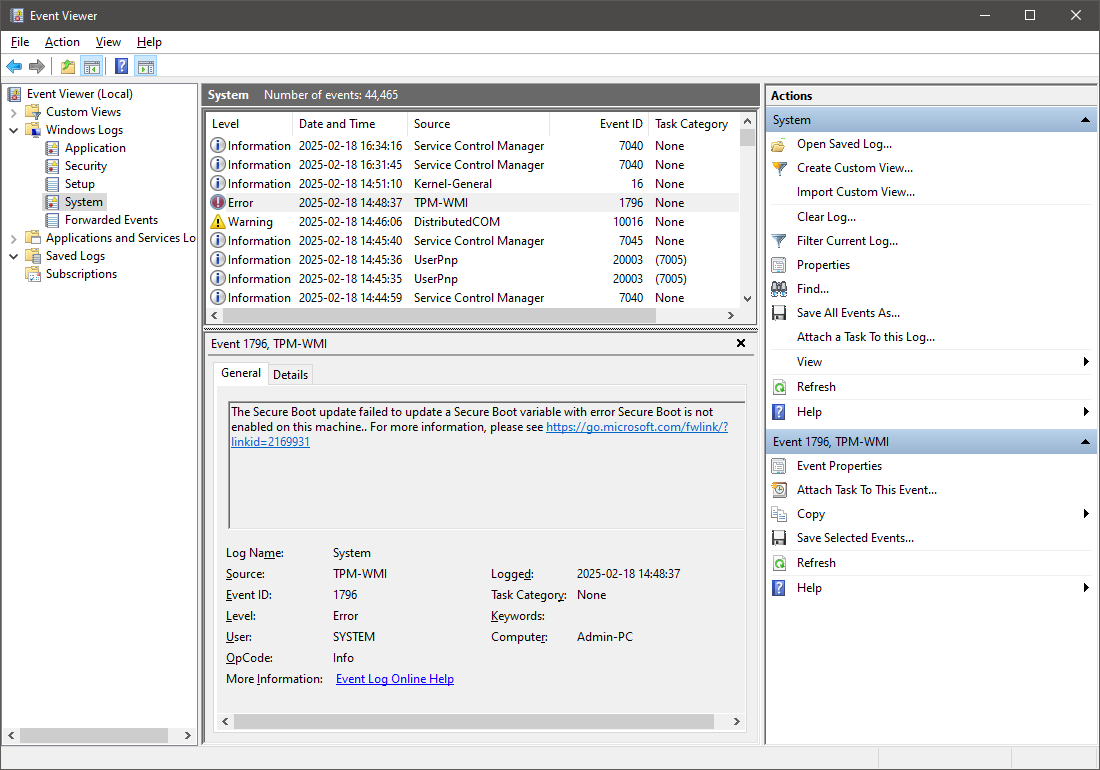
Windows Event Viewer interface
While Event Viewer works well for initial system assessments, it becomes inefficient with large datasets due to limited filtering and searching capabilities.
For advanced users, PowerShell offers an alternative to Event Viewer. It provides a wide range of automation features that facilitate log processing.
Common commands for examining event logs include:
- List all logs: Get-EventLog -List
- Extract security logs (last 50 entries): Get-EventLog -LogName Security -Newest 50 | Format-Table
- Search specific Event ID (e.g., logon event 4624): Get-WinEvent -FilterHashtable @{LogName='Security'; Id=4624}
For example, here is a basic PowerShell script to recursively find .evtx files in the current folder and filter them for Event IDs 4624 and 4625:
$evtxFolder = Get-Location # Start from the current folder
$outputFile = Join-Path -Path $evtxFolder -ChildPath "output.xml"

# Clear output file if it exists
if (Test-Path $outputFile) { Clear-Content -Path $outputFile }

# Get all .evtx files recursively
$evtxFiles = Get-ChildItem -Path $evtxFolder -Recurse -Filter "*.evtx"

# Initialize XML output
Add-Content -Path $outputFile -Value "<?xml version='1.0' encoding='UTF-8'?<`n<Events>"

foreach ($file in $evtxFiles) {
Write-Host "Processing: $($file.FullName)"

try {
# Extract only Event IDs 4624 and 4625 and convert them to XML
$events = Get-WinEvent -Path $file.FullName | Where-Object { $_.Id -in @(4624, 4625) } | ForEach-Object { $_.ToXml() }

if ($events) {
Add-Content -Path $outputFile -Value "`n<!-- Events from: $($file.FullName) -->`n"
$events | Out-File -Append -FilePath $outputFile
 }
}
catch {
Write-Host "Failed to process: $($file.FullName) - $_"
 }
}

# Close XML structure
dd-Content -Path $outputFile -Value "`n</Events>"

Write-Host "Extraction complete. Results saved in: $outputFile"
PowerShell is more flexible than Event Viewer but tends to work slowly with large log files. Furthermore, it has limited output formats, which may not be ideal for the quick assessment of events.
The Log Parser is a command-line tool from Microsoft that enables you to query Windows event logs using SQL-like queries. By adjusting the previous script, you can achieve similar results:
# Recursively find all .evtx files and process them with LogParser
Get-ChildItem -Path . -Recurse -Filter "*.evtx" | ForEach-Object {
$evtxFile = $_.FullName
$outputFile = "$($_.BaseName)_filtered.csv"

# Run LogParser for Event IDs 4624 and 4625
logparser "SELECT TimeGenerated, EventID, Message FROM '$evtxFile' WHERE EventID IN (4624, 4625)" -i:EVT -o:CSV > "$outputFile"

Write-Host "Processed: $evtxFile -> $outputFile"
}
Although native tools provide capabilities for log review and basic triage, Windows forensic investigations benefit significantly from specialized solutions like Belkasoft X, which streamline complex analysis tasks.
Belkasoft X: Built for forensics
Belkasoft X parses Windows event log files from computer images and nested virtual machines, providing a structured view of extracted details. You can find them in the Artifacts window under the System files category:
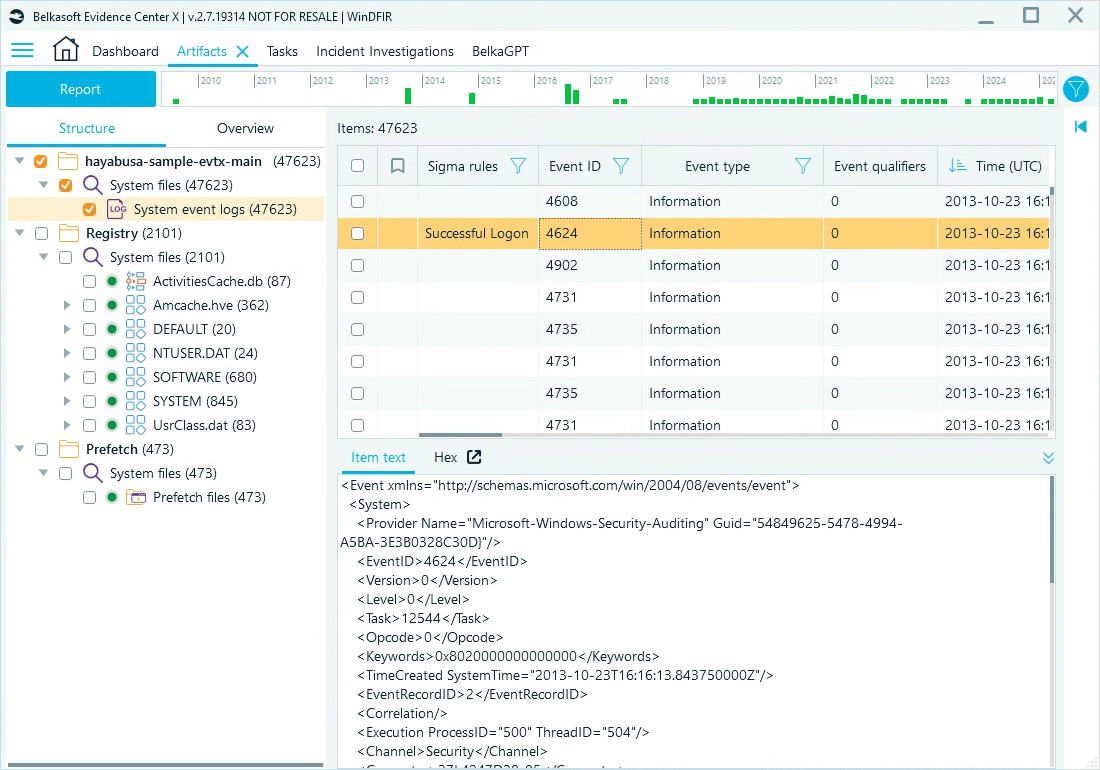
Reviewing the Windows system events parsed by Belkasoft X
Filtering options in the grid view allow you to refine logs based on specific criteria like date ranges, event IDs, or categories:
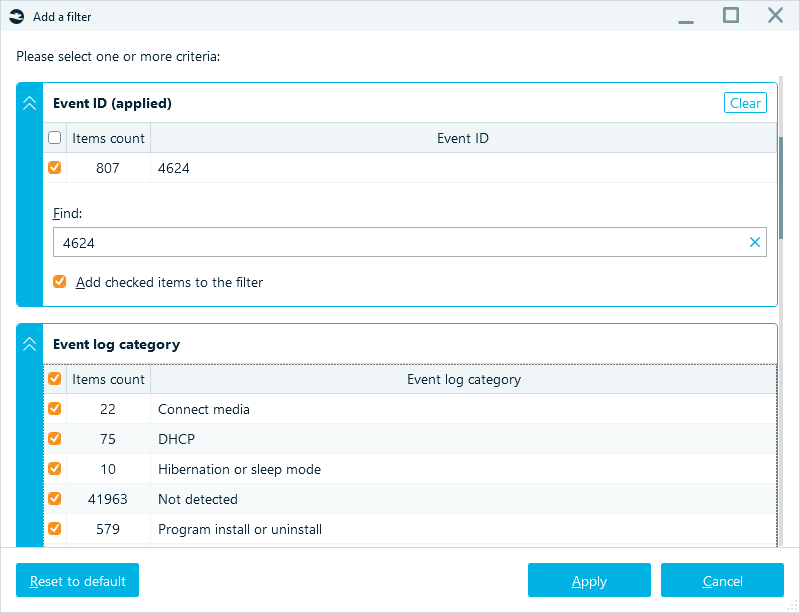
Adding a filter to the Artifact List
Belkasoft X's Corporate edition also provides the Incident Investigations window, which brings together key forensic artifacts commonly examined during the investigation of a cyberattack. Here, it organizes event logs into meaningful categories—such as successful logons, service installations, and more—for easier analysis:
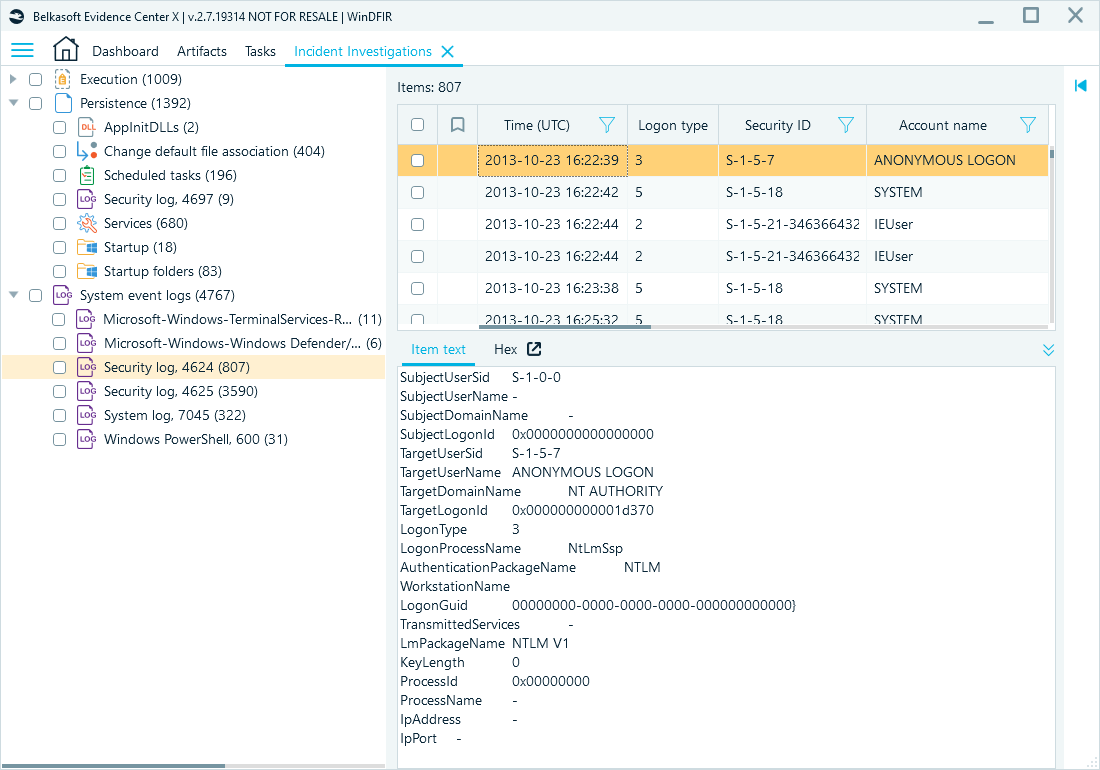
Incident Investigations window displaying successful logon events (Event ID 4624)
Besides extracting and categorizing event log artifacts, Belkasoft X provides you with advanced data recovery and analysis capabilities:
- Carving deleted logs: Recover deleted .evtx files from free and unallocated disk space, revealing hidden or removed evidence of past activities.
- Memory analysis: Extract event log fragments from memory dumps, capturing events lost due to log tampering or overwriting.
- Volume Shadow Copy analysis: Parse Volume Shadow Copies to recover overwritten or deleted logs, offering historical insights into system activities.
- Timeline filtering: Arrange event logs chronologically to reconstruct incident timelines in the Timeline window .
- Sigma rule integration: Automatically detect suspicious events using predefined Sigma rules.
Free tools: Lightweight and handy for data verification
There are several useful open-source and free Windows event log analysis tools. Eric Zimmerman's toolkit, for instance, offers a command-line utility for parsing event logs. Using EvtxECmd, you can parse individual event log files or entire directories and export results to formats like CSV or JSON. For example, a simple command can extract all 4624 and 4625 Event IDs from a folder of .evtx files:
EvtxECmd.exe -d [Input Folder] --csv [Output Folder] --inc 4624,4625

EvtxECmd.exe has found 7 records in our sample file
The tool provides a summary of the records processed for each file, and the output can be reviewed manually or further analyzed with Zimmerman's Timeline Explorer.
Another free option is FullEventLogView by NirSoft. This graphical application allows users to open event logs from a local or remote machine, a specific folder, or a designated file. It also supports command-line operation.
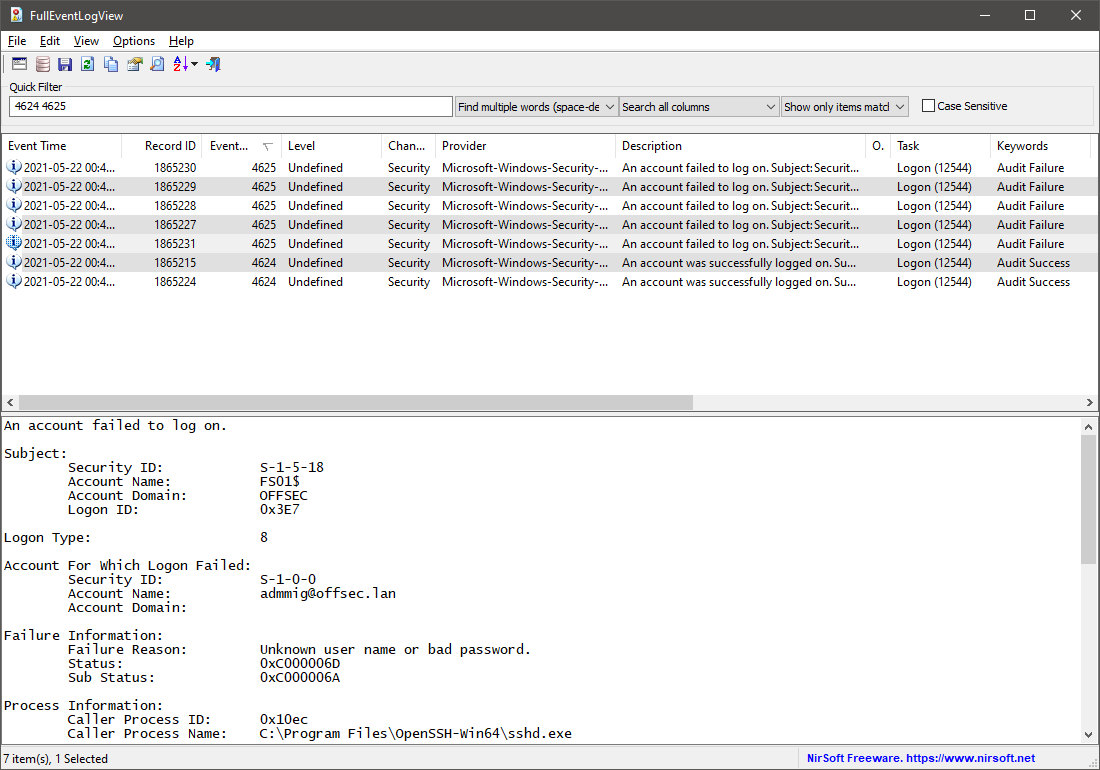
FullEventLogView has found 7 records as well
Native Windows tools and open-source options like Zimmerman's toolkit are fast and convenient for basic triage or quick extraction of specific events. However, digital forensic investigations often involve large volumes of data and require more than just isolated log review. When your task shifts into proper forensic work, you need capabilities like data recovery, automated extraction and categorization of event logs, and the ability to cross-reference them with other artifacts—all of which are made easier with Belkasoft X.
Refining investigations with Sigma rules
Sigma rules standardize the identification of suspicious event patterns, significantly simplifying forensic log analysis. They serve the same purpose for event logs as Snort for network traffic, and YARA for file analysis.
These rules offer a consistent approach for identifying specific patterns in log data, assisting investigators in detecting suspicious activities more efficiently. You can read our walkthrough to learn more about Sigma rules. There is also an extensive repository of pre-made rules.
You can apply Sigma rules to data sources or specific artifact nodes in the Artifacts tree:
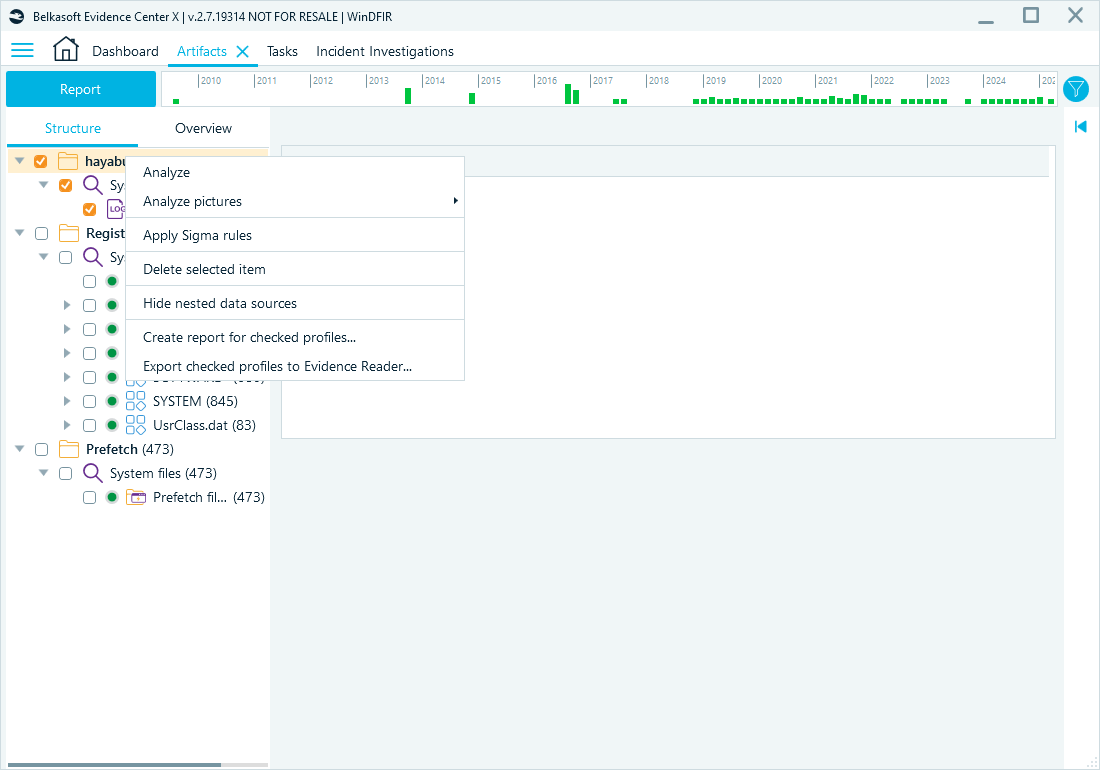
Running Sigma rules from the Artifacts window
You can upload new rules from .yml files, or select necessary ones from previously uploaded:
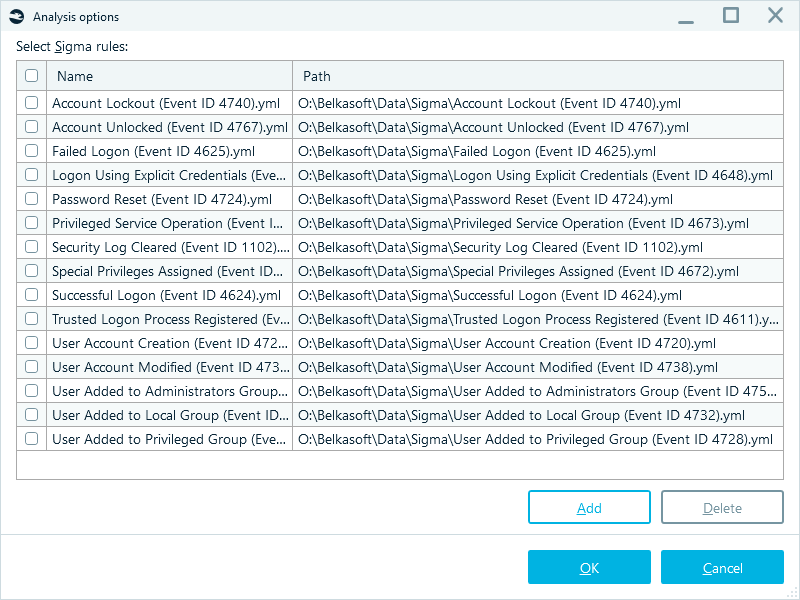
Analysis options with the list of previously uploaded Sigma rules
After the analysis is finished, you will find the results in the Overview tab of the Artifacts window. The event logs that matched the applied rules are displayed under the Sigma category:
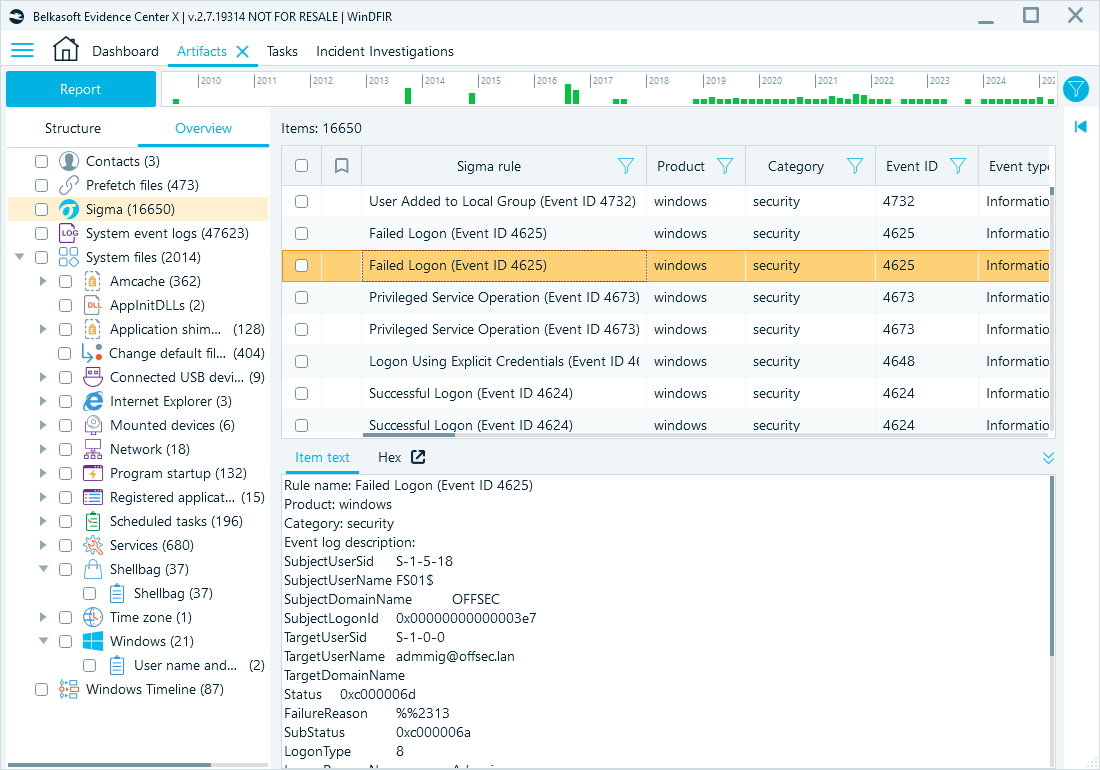
Matched Sigma rules
Common use cases to explore in event logs
Let us review several typical scenarios where event logs can provide valuable information on the incident.
User authentication and privilege escalation
An attacker compromises a user account and escalates privileges. Investigating Event ID 4624 (successful logon) and 4625 (failed logon attempts) can reveal brute-force activity or lateral movement. Examining Event ID 4672 shows whether administrative rights were granted.
Relevant Event IDs:
- 4624: Successful logon
- 4625: Failed logon attempt
- 4672: Special privileges assigned (Admin login)
- 4720: User account creation
- 4724: Password reset attempt
- 4738: User account changed
- 4740: Account locked out
A sudden surge in failed logon attempts (Event ID 4625) originating from a specific source IP address could be a strong indication of an ongoing brute-force attack aimed at guessing account credentials.
Process execution and malware analysis
An analyst investigates a malware infection. Examining Event ID 4688 (new process creation) identifies which executables were launched. If Event ID 7045 is logged, it may indicate that malware has installed itself as a persistent service. If Event ID 1102 is logged, an attacker may have cleared security logs to cover their tracks.
Relevant Event IDs:
- 4688: New process creation
- 7045, 4697: Service installation
- 4700/4701: Scheduled task enabled/disabled
- 1102: Event logs cleared
- 1118/1119/1120: Antivirus remediation has started/succeeded/failed
- 5001: Antivirus configuration has changed
- 4103: PowerShell module logging (records information about modules and commands executed)
- 4104: PowerShell script executed (records the commands run within scripts)
Correlating PowerShell-related events with process creation events ( Event ID 4688) can provide a more comprehensive understanding of an attack that either originates from or involves the use of PowerShell.
File and object access monitoring
A company suspects an insider threat. Reviewing Event ID 4663 reveals access attempts to confidential files. Event ID 5140 provides insights into network share activity, showing whether sensitive files were accessed remotely.
Relevant Event IDs:
- 4663: File access attempt
- 5140: Network share access
- 5142: Network share added
- 5145: Access to a shared folder
These events offer insights into file and object access, guiding investigators to potential data leak incidents.
Log manipulation and tampering
A forensic investigator finds Event ID 1102, indicating that security logs were cleared, potentially covering up malicious activity. Event ID 104 suggests that logging was disabled, which may point to an attempt to evade detection. Correlating these events with other logs can help reconstruct missing activity.
Relevant Event IDs:
- 1102: Security logs cleared
- 104: Log service stopped
- 4689: Process termination
- 4719: Audit policy was changed
Any attempts to clear the audit logs can be a significant indicator of potential malicious activity aimed at concealing an intrusion.
Conclusion
Analyzing Windows event logs is important for DFIR duties because it provides insights into system and user activity. Belkasoft X provides powerful analysis features, from parsing and filtering to advanced recovery of deleted event logs through carving and memory analysis. Leveraging these capabilities ensures comprehensive forensic investigations.
To explore Belkasoft X's advanced Windows Event log analysis capabilities, download a trial and see how it can enhance your investigations.