RAM Forensics: Tools, Techniques, and Best Practices
Some of the most valuable evidence in digital forensics and cyber incident response investigations never touches the disk. It exists only in Random Access Memory (RAM), the computer's high-speed working space where active processes, decrypted data, and live system state reside. This data can be captured and analyzed with memory forensics tools, revealing information about open applications, executed commands, viewed documents, and more.
RAM forensics is particularly indispensable during cyber incidents. It enables investigators to reconstruct attacker activity, detect fileless or injected malware, and gain a detailed view of system state at the moment of compromise—evidence that often exists nowhere else.
This article covers the essential elements of RAM forensics, including the types of data that can be extracted, how to acquire memory safely, and how to analyze RAM images effectively:
- The basics of RAM forensics
- RAM acquisition with Belkasoft Live RAM Capturer
- Approach to RAM analysis in Belkasoft X
- Analyzing a RAM dump in Belkasoft X
- Examining RAM artifacts
As adversaries become more sophisticated, RAM forensics has evolved from a specialized field to a fundamental part of a solid cybersecurity incident response plan. Continue reading to learn practical memory forensics techniques and tips for examining volatile memory with Belkasoft X.
The basics of RAM forensics
RAM is the short-term working memory of a computer. It temporarily stores operating system services, running applications, and data that the system needs to access quickly. This data is volatile: it constantly changes and ultimately disappears when the computer is powered off. That is why, during a cyber incident or criminal investigation, it is critical to acquire a RAM image while the system is live, and as soon as possible—before relevant volatile data gets overwritten.
A memory snapshot, or RAM dump, can reveal evidence not available on disk, such as running processes, network connections, browser traces, active chats, cloud application data, injected code, malware, rootkits, passwords, and encryption keys.
Besides live RAM, you can find memory artifacts in the following locations:
- Hibernation file (hiberfil.sys): Contains a snapshot of system memory captured when the computer last entered hibernation mode
- Page file (pagefile.sys): Acts as virtual memory by temporarily storing memory pages that have been swapped out of RAM to free up physical memory
- Swap file (swapfile.sys): Stores memory data from suspended Universal Windows Platform (UWP) apps to enable quick app suspension and resume
These files reside on the disk. They can help recover volatile evidence from earlier activities or, when live memory acquisition is not possible, serve as the primary source of memory artifacts.
The RAM forensics process typically involves two stages: acquisition and analysis. Each stage relies on specialized tools, techniques, and best practices.
RAM acquisition
Live memory acquisition often requires kernel-mode tools like Belkasoft Live RAM Capturer. Such tools operate at the highest privilege level of the operating system, granting unrestricted access to all physical memory, including protected areas. Belkasoft Live RAM Capturer is designed for Windows-based computers. To acquire RAM contents from other platforms, you can use tools like LiME for Linux and OSXPmem for macOS. During acquisition:
- Avoid launching new applications: New processes may overwrite volatile memory and change the state you intend to capture.
- Run acquisition from external media: Running the acquisition tool from a storage device that cannot write to the target system prevents unintentional modifications to system files, logs, and memory.
- Capture full memory when possible: A raw image, such as the .raw or .mem format, preserves the original RAM structure and maintains compatibility with common forensic tools.
RAM analysis
A memory dump file looks like a big raw binary blob with seemingly random hex values and unreadable characters, which may make no sense until you analyze it with a specialized memory forensics tool. The following techniques and tools can help with memory analysis:
- Carving: Recover raw content from memory by scanning for known file signatures and structural patterns. Carving reveals pictures, chat remnants, LNK files, and other fragments that may not be visible in structure-based analysis.
- Structure-aware analysis: Using tools like Volatility, you can extract processes, loaded drivers, files, and other structures stored in memory. Such an analysis can help reveal persistence mechanisms, code injection, and runtime-only malicious activity.
- Rule-based refinement: Apply YARA rules to identify known signatures in memory. Use Sigma rules to flag significant event-log patterns.
The following sections will review each step in detail, demonstrating how Belkasoft X can help with memory forensics tasks.

RAM acquisition with Belkasoft Live RAM Capturer
Belkasoft RAM Capturer is a free, portable tool designed to acquire RAM on Windows systems. The tool runs in kernel mode to bypass anti-dumping protections, creating forensically sound raw memory dumps (.mem format) in both 32-bit and 64-bit versions. It requires no installation and has a minimal system footprint.
To obtain a machine’s memory dump using Belkasoft RAM Capturer, run it as an administrator on the target machine (preferably from a USB drive). Select an external drive as the output destination, and then click Capture! to begin.
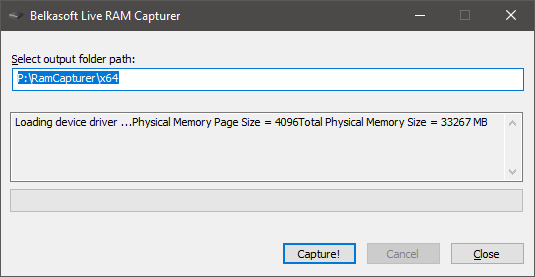
Belkasoft RAM Capturer
You can also acquire RAM, as well as other artifact types, using Belkasoft Triage on a local machine or using Belkasoft R on a remote one.
Approach to RAM analysis in Belkasoft X
After acquiring a memory image, you can add it to your case in Belkasoft X. The software automatically analyzes the memory dumps and extracts a wide range of artifacts, requiring minimal manual setup.
Belkasoft X’s approach to memory analysis is twofold:
- Raw data carving on byte sequences
- Structure-aware analysis with Volatility integration
We will explore both approaches more closely in the next sections.
What is carving?
Data carving is a technique used to recover files or data fragments directly from raw data sources, such as memory dumps or free, unallocated, and slack space on hard disks. It works by searching for known file signatures (headers and footers) or using other structural patterns.
Carving does not depend on the operating system's "directory" (such as the active process lists or file handle tables). Instead, it scans the entire "haystack" of memory to find the "needles" you are searching for.
Belkasoft X supports carving of a large number of memory artifacts out of the box, including URLs, emails, documents, pictures, and more. It also allows you to configure custom file signatures for additional file types.
What is Volatility?
Volatility is an open-source framework for analyzing the contents of a computer's RAM dump. Volatility is executed from the command line and provides plugins that analyze memory structures to retrieve OS artifacts, such as system libraries, processes, services, specific files, and other in-memory artifacts.
Belkasoft X integrates Volatility features to provide the capabilities of structure-based analysis in an easy-to-to use interface with smart parsing, filters, and data viewers. Belkasoft X supports the following Volatility plugins:
- pslist and memmap: provide the information about the running processes
- dlllist: retrieves information about the loaded dynamic link libraries (DLLs)
- filescan: identifies any open or deleted files
- modules: retrieves a list of loaded kernel modules
- malfind: identifies potentially injected or malicious code
Carving handles the extraction and presentation of numerous artifacts, while Volatility provides more in-depth, structure-aware analysis, making the overall toolset more powerful.
Setting up Volatility in Belkasoft X
Before you begin working with Volatility plugins in Belkasoft X, you need to configure the integration:
- Download and unpack the compiled Volatility distribution file vol-3.exe to any folder.
- Download Symbol tables, unzip and place, as named, into the symbols directory next to the executable file.
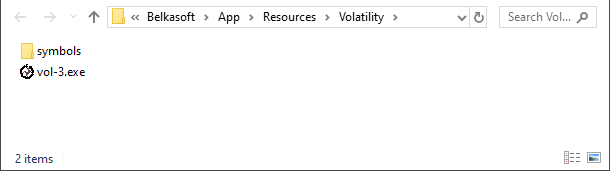
Volatility folder ready to work
- In the Home window of Belkasoft X, open the settings and navigate to the Third-party tab.
- Specify the path to vol-3.exe, then click Apply.
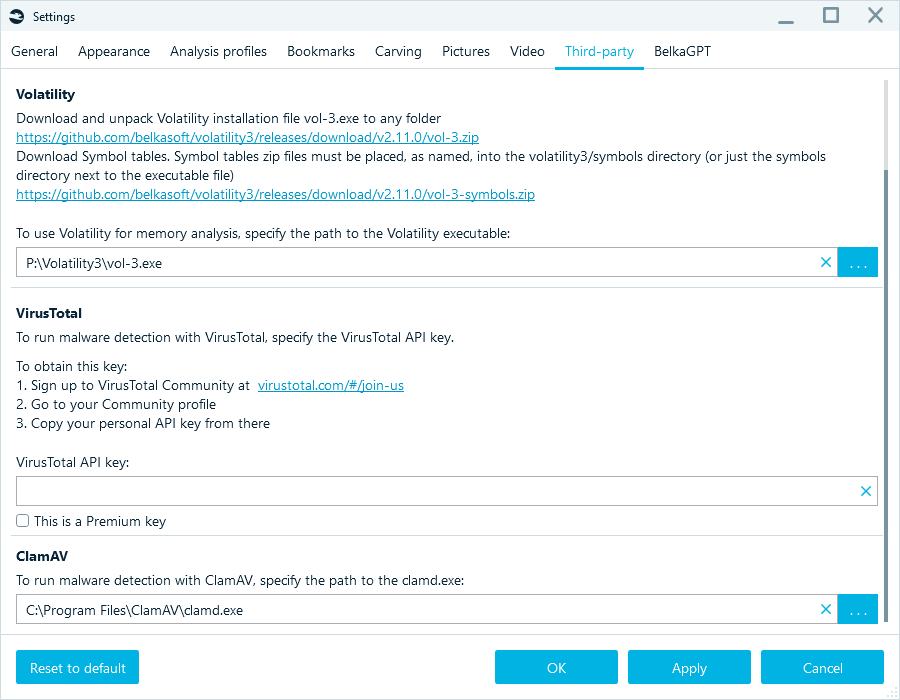
Setting up Volatility in Belkasoft X
The first time you add a memory dump for analysis after initial setup, Belkasoft X will cache data from the symbols folder, which can take additional time.

Analyzing a RAM dump in Belkasoft X
To analyze a memory dump in Belkasoft X:
- Add a data source to a case. In the Add existing menu, choose Memory dump type data source to a case.
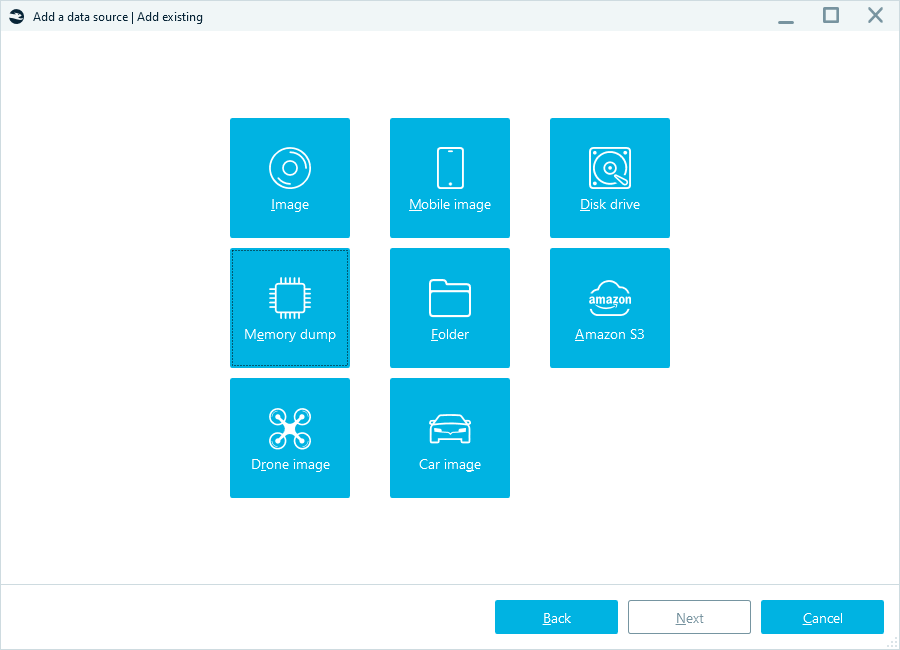
Adding a memory dump to the case
- Select the target memory dump:
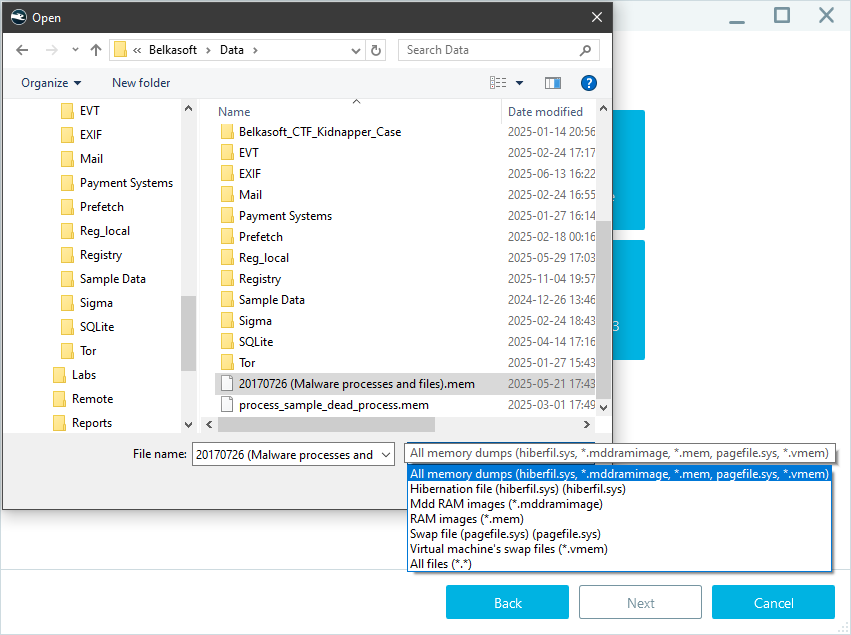
Belkasoft X supports various memory dump formats
- Next, select the analysis options:
- Carve all space: Enable this feature to extract remnants of artifacts from memory based on their signatures.
- Extract processes: This option enables you to parse the dump with supported Volatility modules. Additionally, you can scan the uncovered files for known malware using the following options:
- Check malware names: Checks extracted processes for suspicious names, such as scvhost.exe instead of svchost.exe, which likely indicate malware mimicking system processes.
- Check processes with VirusTotal: Sends the extracted data to VirusTotal for further analysis, leveraging their cloud-based detection capabilities.
- Check processes with ClamAV: Uses ClamAV's signature-based detection engine to scan running processes in memory for potential threats.
Note: The VirusTotal option requires an Internet connection and a valid VirusTotal API key configured in the settings. The ClamAV option requires installing clamd.exe and configuring additional settings in Belkasoft X.
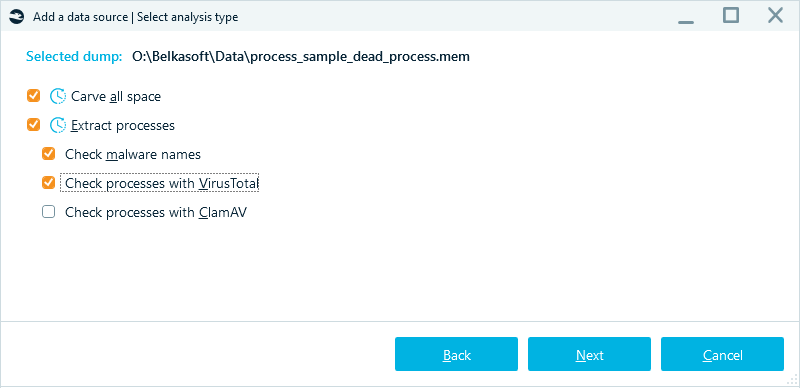
Memory analysis settings
- Your further actions in the Select advanced analysis options window follow the standard workflow of adding a data source to your case. Besides verifying found processes with VirusTotal and ClamAV, it could also be helpful to:
- Add YARA rules to identify specific files, processes, or malware in your findings
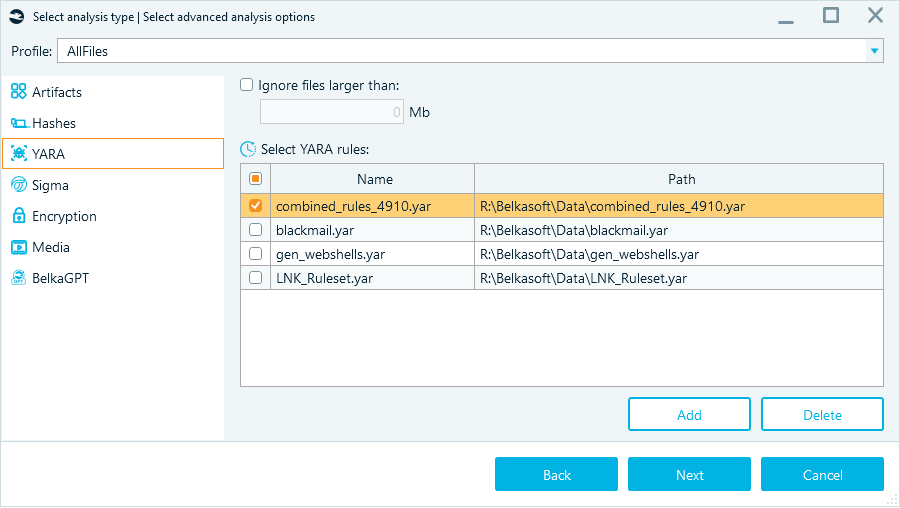
Configuring YARA rules for memory analysis
- Use Sigma rules to highlight specific log events or event patterns
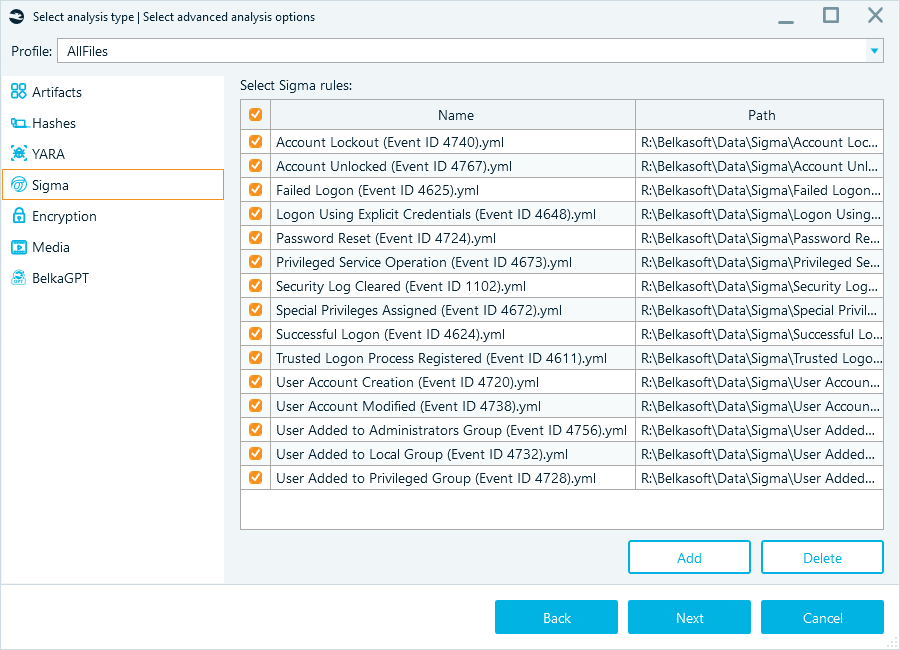
Sigma rules in analysis options
Examining RAM artifacts
To demonstrate the differences in processing across different analysis settings, we loaded the same memory dump into Belkasoft X twice. We analyzed it using two methods—carving only (results outlined in red) and with Volatility only (results outlined in green):
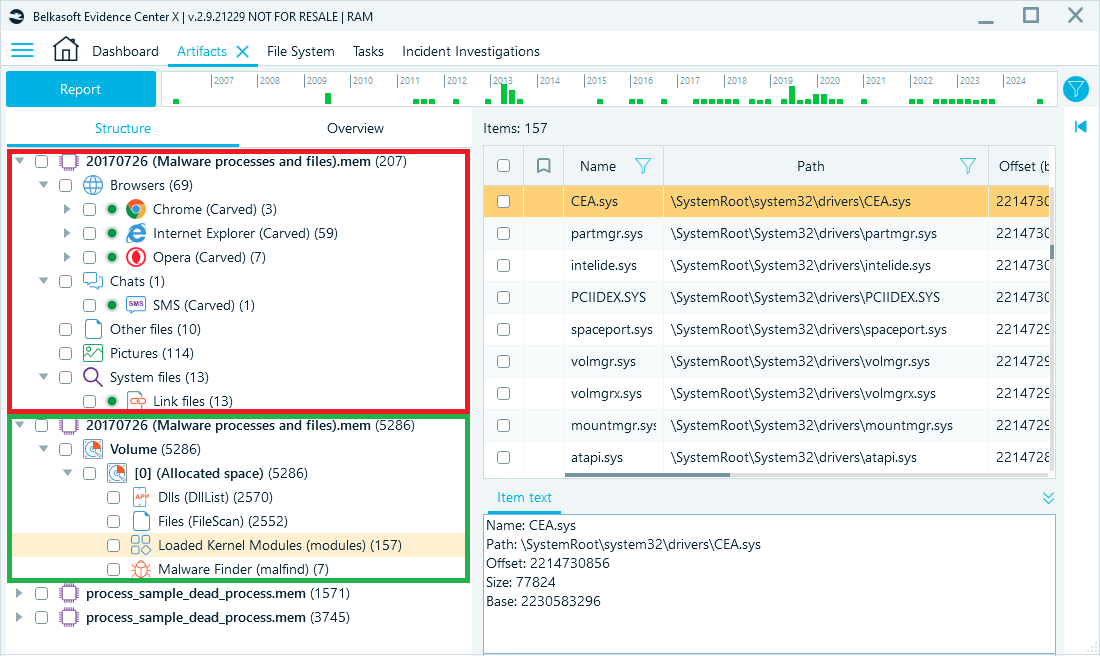
Carved data in red, Volatility results in green
As shown in the screenshot above, carving has recovered browser artifacts, chat remnants, pictures, LNK files, and other files and fragments. Volatility, on the other hand, has extracted memory structure-based artifacts, such as DLLs, loaded files, and processes. These two approaches complement each other to deliver a comprehensive view of memory artifacts.
Carving results
Carving extracts raw content, revealing data that applications loaded into memory, even if the same data no longer exists on the disk drive. A typical example is browser activity. You can retrieve visited websites from memory remnants even when the browsing history was cleared or incognito mode was used.
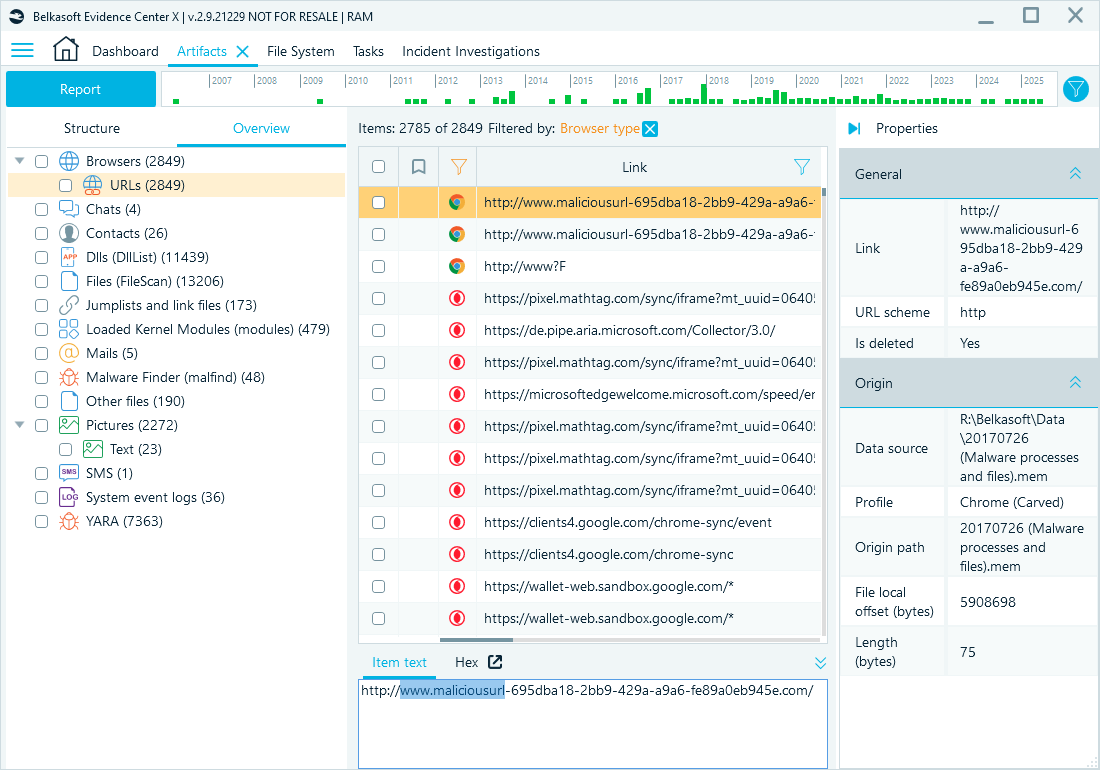
Visited URLs can be cleared from the browser history but remain in memory
Another good example is pictures stored in memory, although some may be incomplete or corrupted:
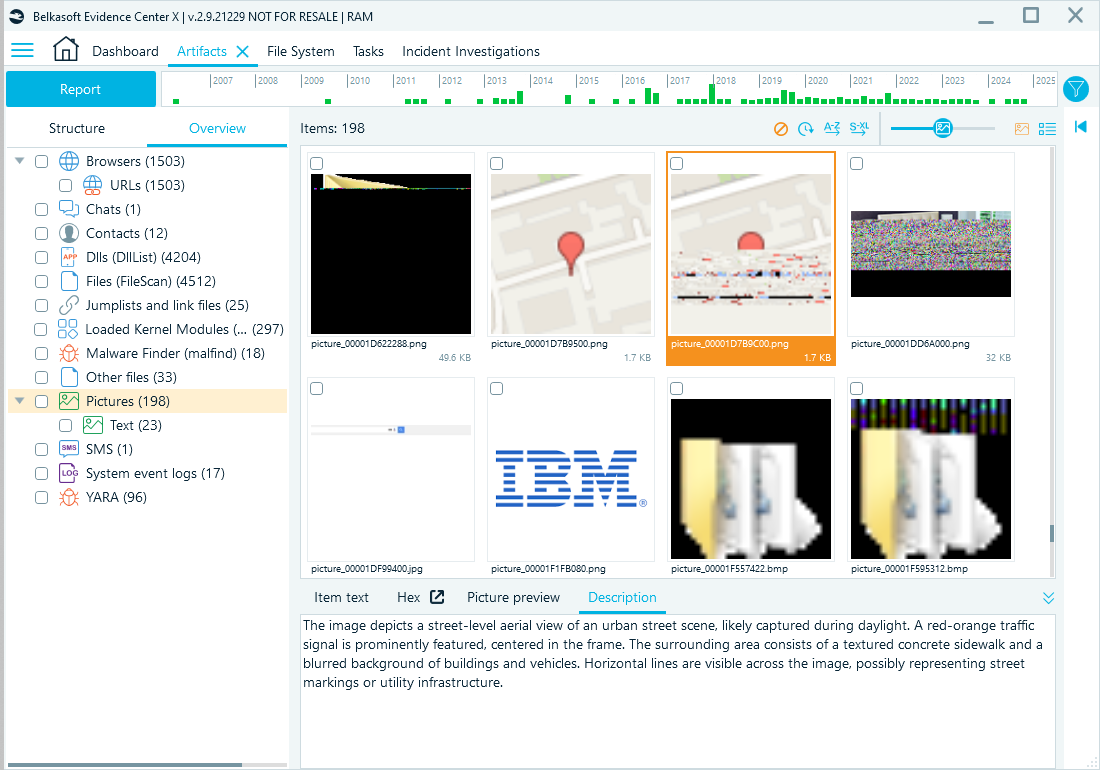
Picture remnants can also stay in memory
Volatility results
Volatility extracts memory structure-based artifacts, such as processes, DLLs, and loaded files.
Belkasoft X displays the information on extracted memory processes in the File System window. This data is extracted using the combination of the pslist and memmap plugins and displayed as a sortable and filterable list. Each process is shown with its name, creation time, size in memory, process ID (PID), parent process ID (PPID), and other details that help reconstruct the system state. Here, you can do the following:
- Examine the processes in the Hex viewer
- Dump them for further analysis using the Save to file option (note that Belkasoft X dumps the entire virtual address space (all mapped regions) of the process)
- Run YARA rules against selected processes or the entire memory dump
- Initiate malware analysis with VirusTotal and ClamAV.
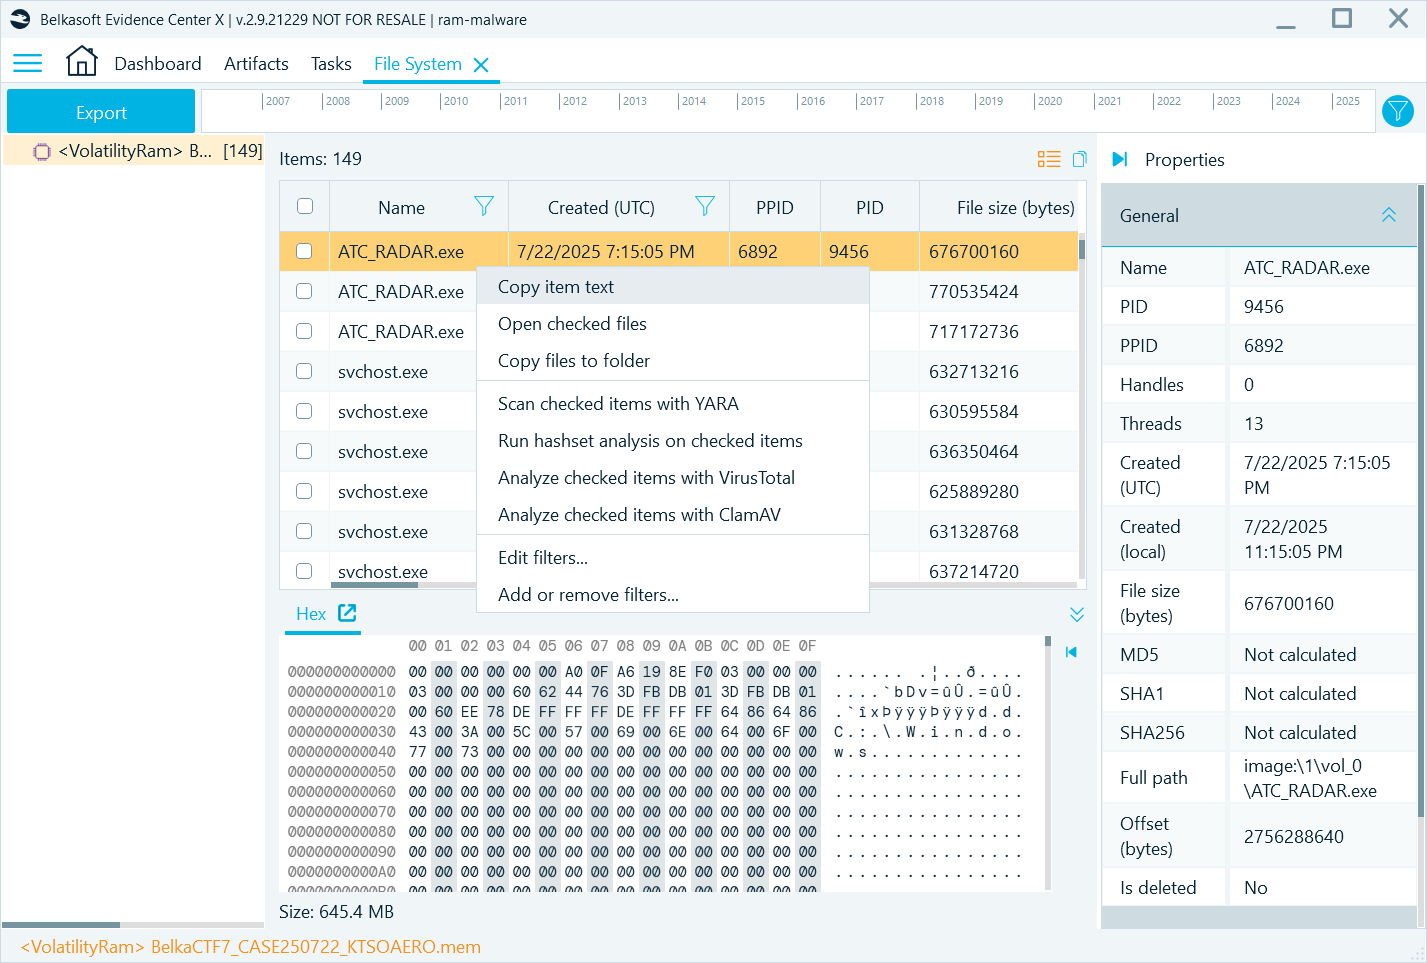
Processes retrieved for a memory dump in Belkasoft X
In the Artifacts window, you can locate the results returned by other supported Volatility modules. The Dlls (DllList) profile shows results from the dlllist plugin, revealing which DLLs are loaded by each process. Here you can look for such anomalies as:
- DLLs loaded from unexpected locations (user temp, Downloads, AppData\Roaming, network shares, USB paths)
- DLLs with random or misspelled names
- Legitimate DLLs loaded by suspicious processes
For example, this can help you identify which DLLs a process loads during abnormal behavior, such as a ransomware attack:
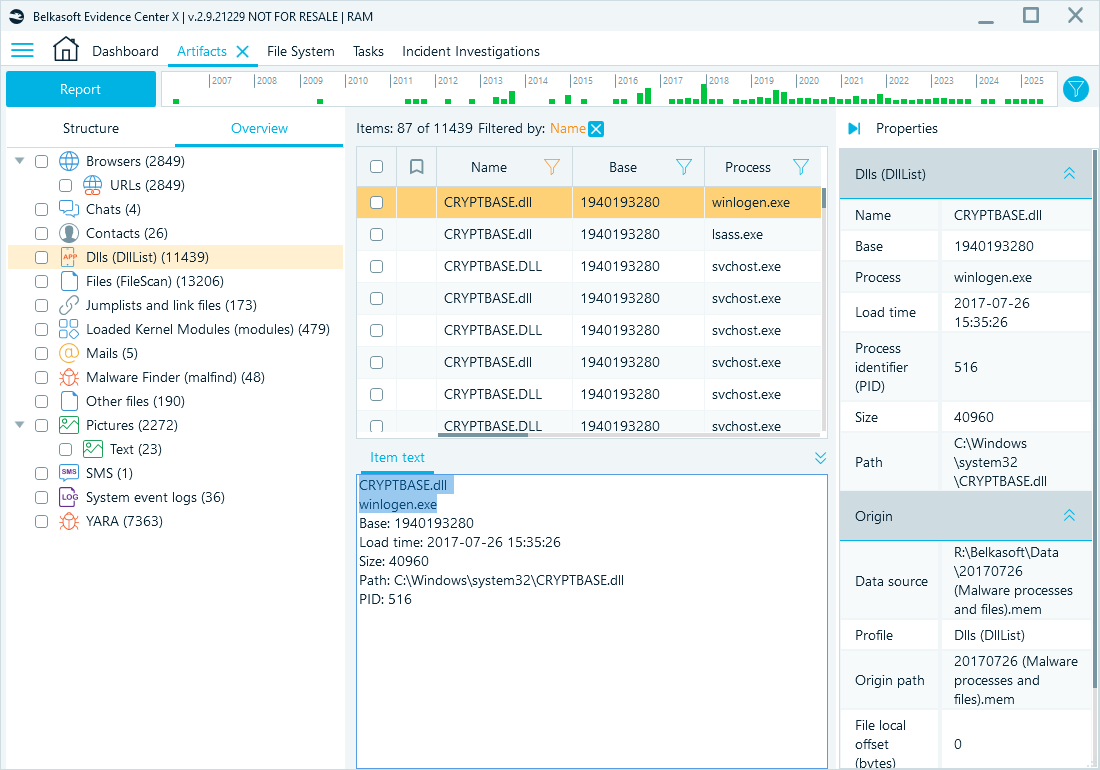
Legitimate cryptbase.dll used by a suspicious process, winlogen.exe
Manual inspection of processes and DLLs takes time. Volatility’s malfind plugin whose results Belkasoft X displays under the Malware Finder (malfind) profile, can help prioritize which processes to inspect. It detects hidden or injected code by scanning memory regions for suspicious traits such as read-write-execute permissions, missing file-backed mappings, and unusual headers. These anomalies can reveal fileless malware or injected shellcode that attempts to masquerade as legitimate activity.
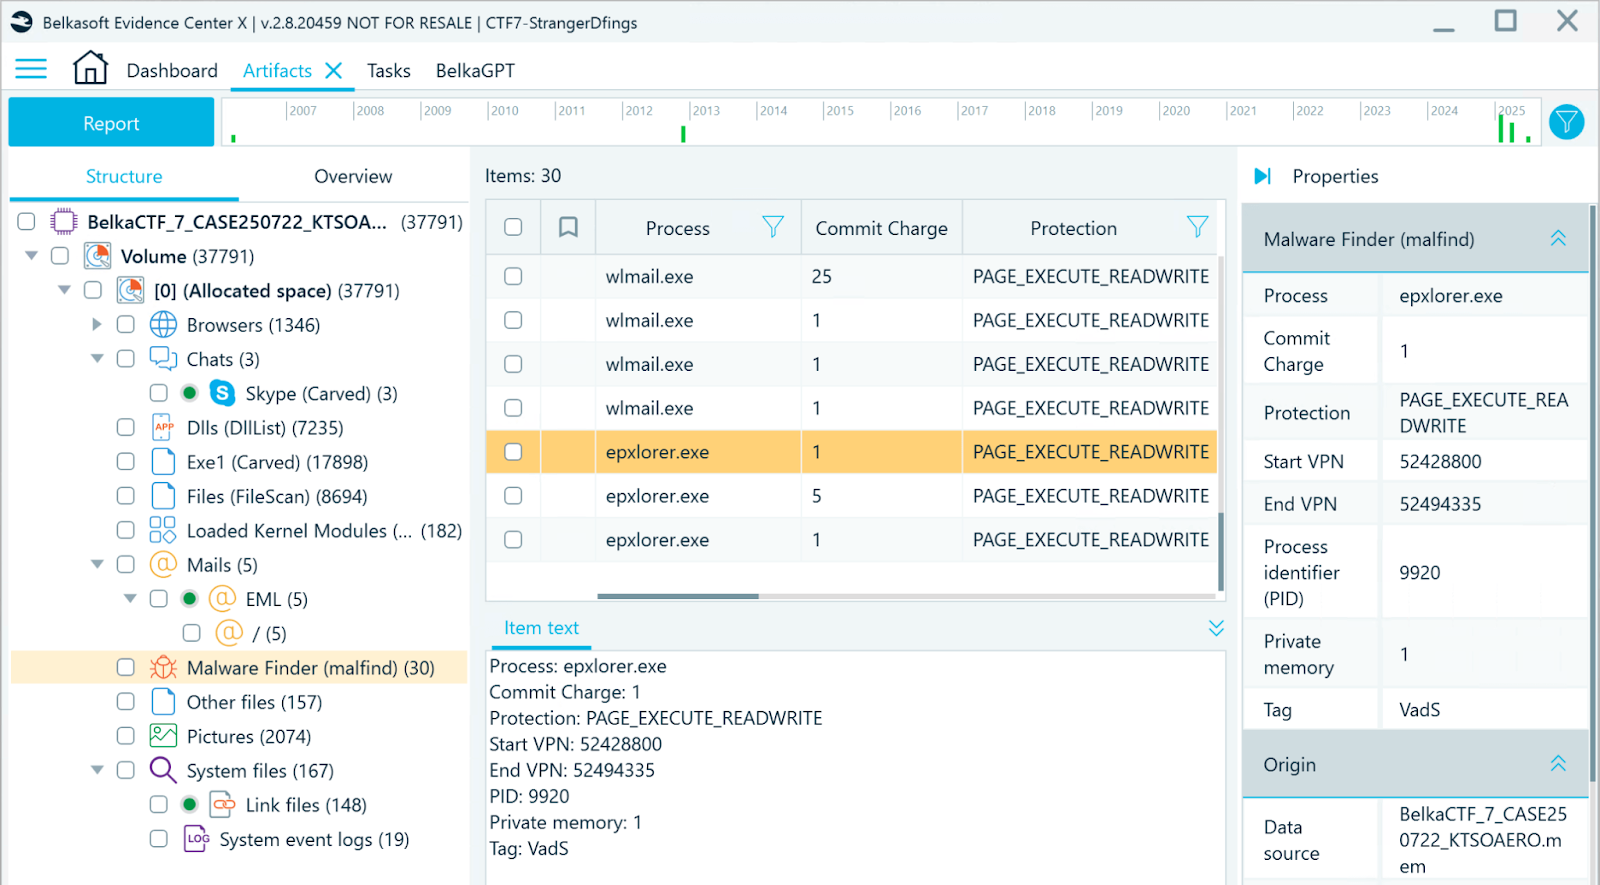
Processes retrieved by the malfind plugin, displayed in Belkasoft X
YARA and Sigma rules for memory analysis
Targeted analysis methods can highlight even more valuable artifacts. In particular, YARA rules can detect files and processes by their custom signatures. You can use community-shared rules or create specialized rules for your investigation.
For example, in the screenshot below, you can see the OneDrive process highlighted by a YARA rule created by JPCERT/CC (Japan Computer Emergency Response Team Coordination Center) to detect signatures of the TSCookie malware family in memory.
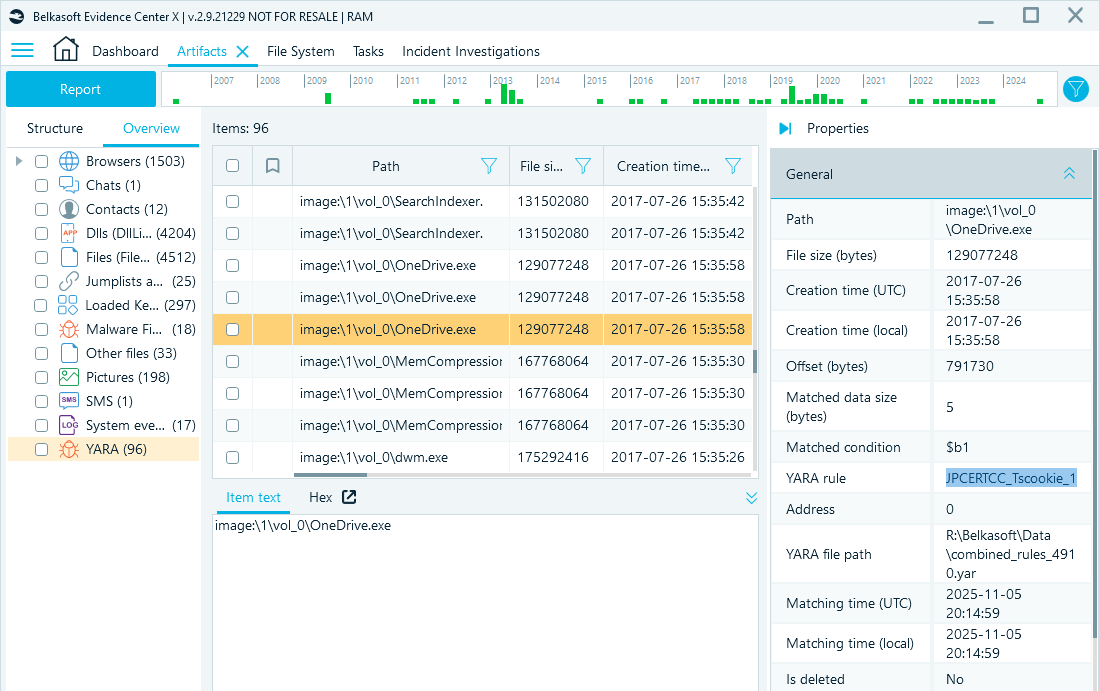
YARA rules can identify malware signatures that an antivirus might miss
Similarly, Sigma rules will help highlight specific log events or patterns. In the screenshot below, the Failed Logon (ID 4625) event is flagged by the Sigma rule:
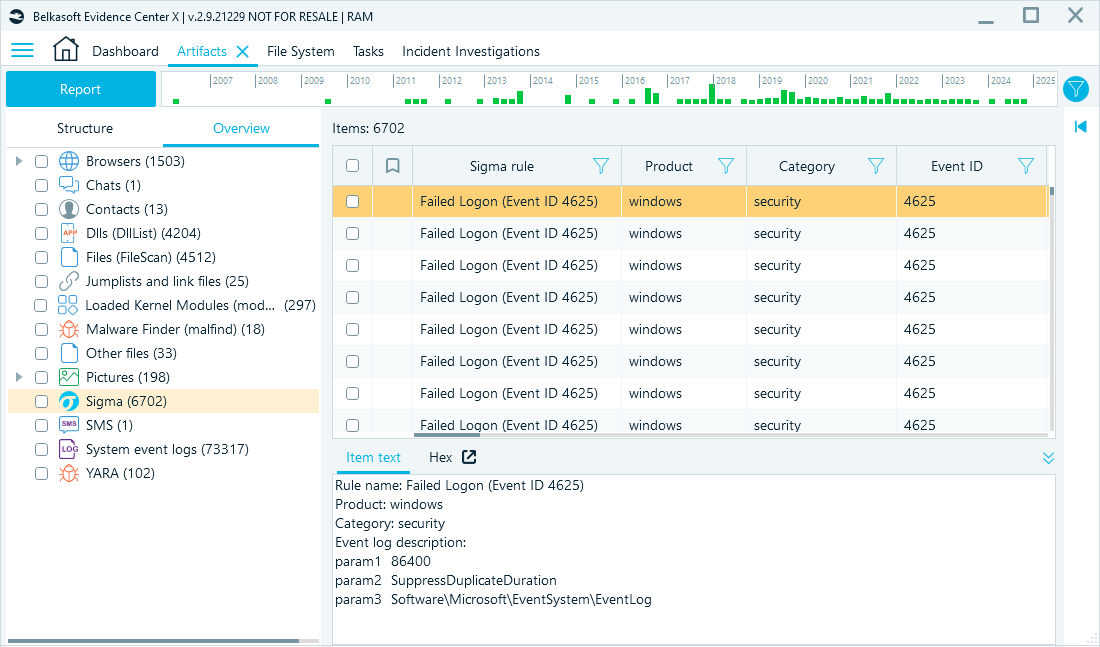
Sigma rules assist you in highlighting important event log patterns
Conclusion
RAM forensics is crucial for detecting real-time system activity and evidence that traditional disk analysis does not cover, particularly during threat hunting and malware analysis. Although challenges persist, techniques like data carving are crucial for extracting valuable information. Tools such as Belkasoft RAM Capturer provide a reliable way to capture volatile memory, while Belkasoft X offers a robust platform for comprehensive analysis and carving, making it easier to uncover what is stored in RAM.
For those who want to test their RAM forensics skills and explore Belkasoft X capabilities on a live memory dump, you can download BelkaCTF #7: Stranger Dfings CTF image and follow its steps with the help of the official write-up.