Belkasoft X user interface
Belkasoft X user interface
Belkasoft X uses different tabs to provide various views and functions to help you manage your cases, review artifacts, analyze devices and dumps, and perform low-level analysis tasks on raw data.
When you click on the menu icon  at the top-left corner, you see the list containing these tabs (only if a case is loaded, otherwise, 'exit' only):
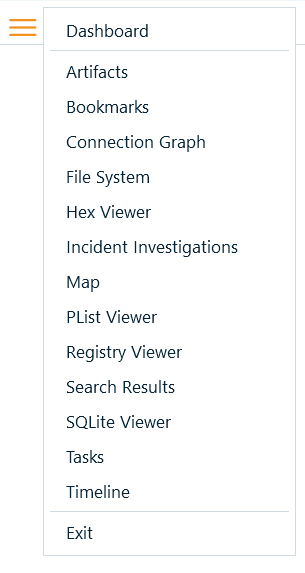
Dashboard. This is the main screen for managing an open case. Here, you get to edit a case’s properties, perform actions on the case, review its statistics, find automatic searches, and so on.
Artifacts. This is the main screen for reviewing artifacts extracted in your case. Here you can go through artifacts, based on categories or groups, view their properties, perform filtering and search, create reports and so on.
Bookmarks. This is the main screen for viewing the bookmarks you created for artifacts. Here, you able to examine bookmarks (in depth), edit them, and also delete them.
Connection Graph. This is the main screen for reviewing connections. Here, Belkasoft X provides a high-level communication diagram that shows the connections between individuals in your case.
File System. This is the main screen for examining data source locations and their attributes on a low level. Here, you can view partitions and volumes, volume shadow copy snapshots (if available), folders and files, and memory processes for RAM dumps.
Hex Viewer. You can use this tab to review a file, processes, or a data source (in its entirety) on a byte level. You can also perform type conversions, run search tasks, bookmark pieces of bytes, and so on.
Incident Investigations. This screen combines various artifacts from various data sources such as registry, Event log and others, which can help in a course of an incident response case.
Map. This screen allows you to review artifacts having geolocation on Open Street Maps (with an Internet connection) or Google Earth (if its installed locally).
Plist Viewer. You can use this tool to view Mac property lists including binary format.
Registry Viewer. You can use this tab to review registry entries and files.
Search results. This is the main screen for reviewing searches.
SQLite Viewer. You can this tab to examine the contents of SQLite databases. This viewer unveils database schema and table row data; it supports journal, WAL, freelist and SQLite unallocated space reviewing.
Timeline. This is the main screen for reviewing events or activities based on time. Here, Belkasoft X combines all the artifacts involved in a case.
Tasks. This screen helps managing tasks in Belkasoft X. It provides information on task statuses and useful logs. Here, you can stop tasks.
See also:
Dashboard
Artifacts
Bookmarks window
Connection Graph
File System
Hex Viewer
Incident Investigations
Showing geolocation artifacts on Open Street Maps or Google Earth
Plist Viewer
Registry Viewer
Search Results window
SQLite Viewer
Timeline
Tasks